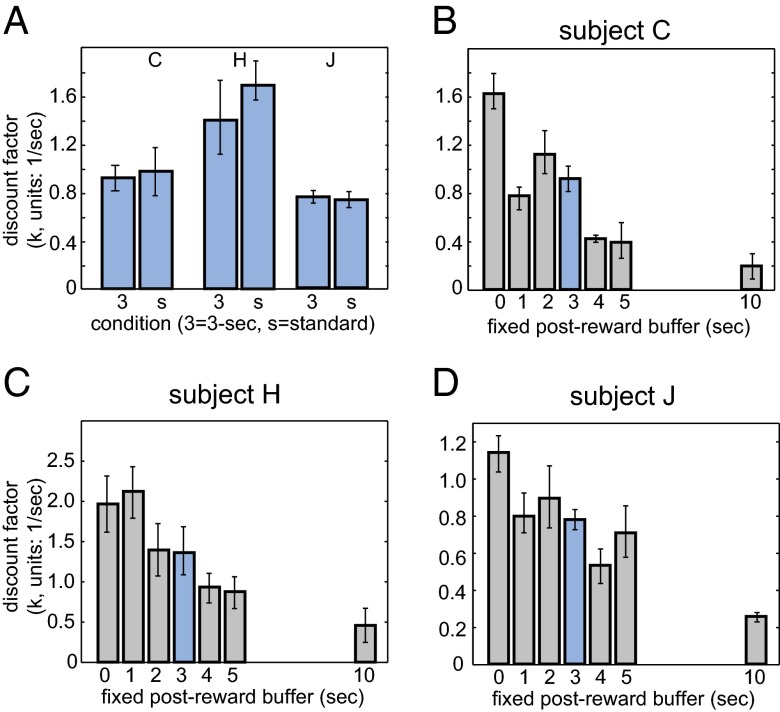
Fig. 4.
Preferences depend on duration of buffer in the constant buffer variant of the standard intertemporal choice task. Each plot shows the relationship between measured discount factor (k) and duration of postreward buffer. Data for the 3-s buffer is highlighted (blue) because the expected postreward delay for the 3-s buffer trials matches that for the standard version of the task and for the random buffer version of the task. (A) Data for 3-s condition. (B–D) Data for subjects C, H, and J, respectively, for all conditions.

