
Fig. 1.
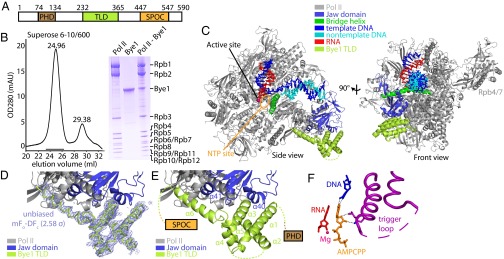
Structure of the Pol II–Bye1 elongation complex. (A) Bye1 domain organization. Bordering residue numbers are indicated. (B) Pol II and Bye1 form a stable complex. Pol II was incubated with an excess of Bye1 and subjected to size-exclusion chromatography. The elution profile (Left) reveals a stable Pol II–Bye1 complex (elution volume, 24.96 mL) and excess Bye1 (29.38 mL). SDS/PAGE analysis of fractions indicated with a black horizontal line confirmed the presence of a Pol II–Bye1 complex (right lane of the Coomassie-stained SDS/PAGE gel shown on the Right). For comparison, pure Pol II and recombinant Bye1 have been included in SDS/PAGE analysis. (C) Ribbon model of the Pol II–Bye1 elongation complex crystal structure. The views correspond to the side and front views of Pol II (46) and are related by a 90° rotation around a vertical axis. (D) Sigma-A–weighted difference electron density (blue mesh, contoured at 2.58σ) for the Bye1 TLD (green). The Fourier coefficients used for map calculation were mFo − DFc (Fo = observed structure factor amplitude, Fc = structure factor amplitude calculated from the Pol II structure alone, m = figure of merit, D = Sigma-A weighting factor). (E) Close-up view of the Pol II–Bye1 interaction. Mobile loops are indicated by dashed lines. (F) Contacts of AMPCPP with the closed trigger loop in the AMPCPP-containing Pol II–Bye1 elongation complex structure. Residues involved in hydrogen bond formation are shown as sticks; hydrogen bonds are indicated by dashed lines. A few residues of the trigger loop that face away from the AMPCPP are mobile (dashed line).