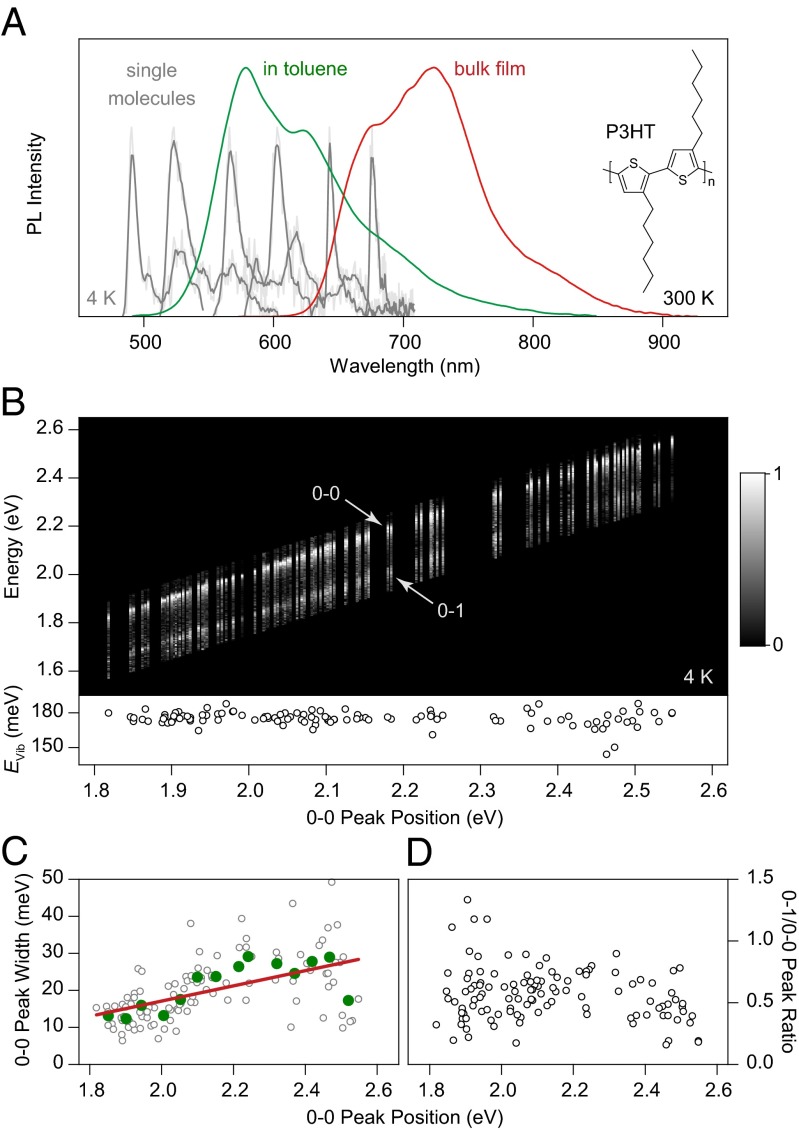
Fig. 1.
Unraveling the spectral heterogeneity of P3HT using low-temperature single-molecule spectroscopy. (A) Comparison of P3HT PL spectra in dilute toluene solution (green) and in a drop-cast bulk film (red) at room temperature. Six representative low-temperature (4 K) single-molecule spectra (gray), consisting of a zero-phonon line and a vibronic progression, are shown as examples, spanning the spectral region from dilute solution to bulk film. (B) Normalized PL spectra of 115 single molecules, sorted by the peak energy of the 0–0 transition. The same 0–1 vibronic transition, shifted by 180 meV from the main peak, is seen for all spectra (Lower). (C) Correlation of 0–0 peak width with transition energy. The green circles represent averages over eight molecules, and the red line is a guide to the eye. (D) The intensity of the vibronic peak does not depend on chromophore transition energy.

