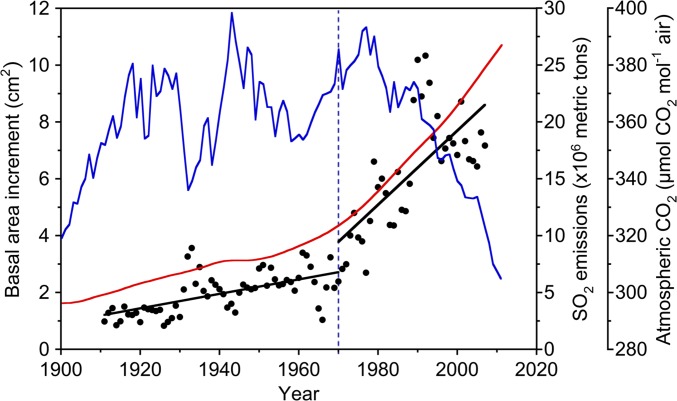
Fig. 1.
Basal growth of 118- to 480-y-old J. virginiana trees in a stand located in the Central Appalachian Mountains over the past century (n = 5 trees). The vertical blue dotted line represents the approximate date of the Clean Air Act (1970). Before 1970, y = 0.025x − 47.4, r2 = 0.38, P < 0.0001; after 1970, y = 0.130x – 253.1, r2 = 0.49, P < 0.0001. The slopes of the relationships between BAI and year before and after 1970 are different (P < 0.0001). Superimposed over BAI are trends of atmospheric CO2 concentrations (red line) (7, 8) and historical sulfur emissions in the United States (blue line) (9, 10).

