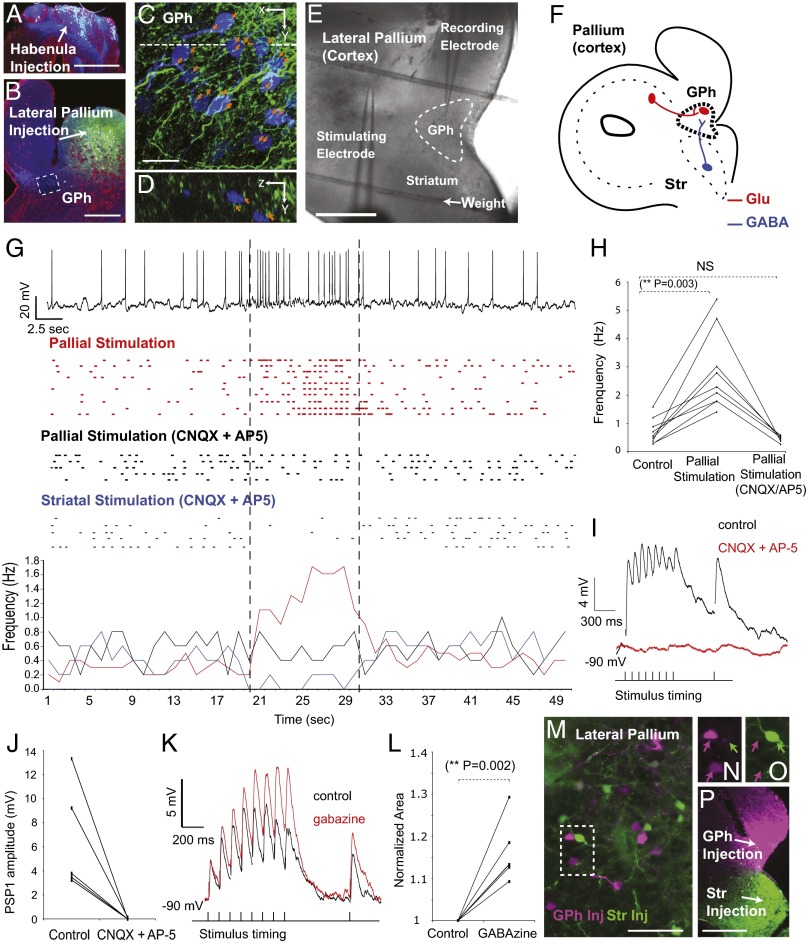
Fig. 5.
Direct glutamatergic (Glu) projections from the pallium (cortex) excite neurons in the GPh. (A–D) Confocal photomicrograph showing that anterogradely labeled fibers (green) (C and D) from the pallium (B) form direct putative contacts (red arrows) with retrogradely labeled GPh neurons (blue) (A, C, and D). (E) Photomicrograph showing the location of the stimulating and recording electrodes in a transverse section of the lamprey brain. (F) Schematic representation of the projections from the pallium and striatum to the GPh. (G) Whole-cell recording and raster plot of a spontaneously active neuron in the GPh showing the effect of pallial and striatal stimulations. (H) Graph showing the spontaneous firing frequency before, during pallial stimulation and following application of the glutamatergic antagonists CNQX 40 μM and AP5 50 μM. (I) PSPs recorded in a spontaneously active GPh neuron following pallial stimulation, before and after (red trace) the application of CNQX (40 μM) and AP-5 (50 μM), which abolishes the EPSPs. (J) Graph showing the amplitude of the first PSP before and after the application of CNQX and AP-5. (K) PSP recorded in a spontaneously active GPh neuron following pallial stimulation, before and after the application the GABAA receptor antagonist gabazine 10 μM. (L) Graph showing the normalized area under the graph before and after the application of gabazine. (M–P) Retrogradely labeled neurons in the pallium following injection in the GPh (magenta) and striatum (Str) (green) (P). All stimulation artifacts were manually removed. (Scale bars: C, 25 μm; M, 100 μm; A, B, E, and P, 200 μm.)

