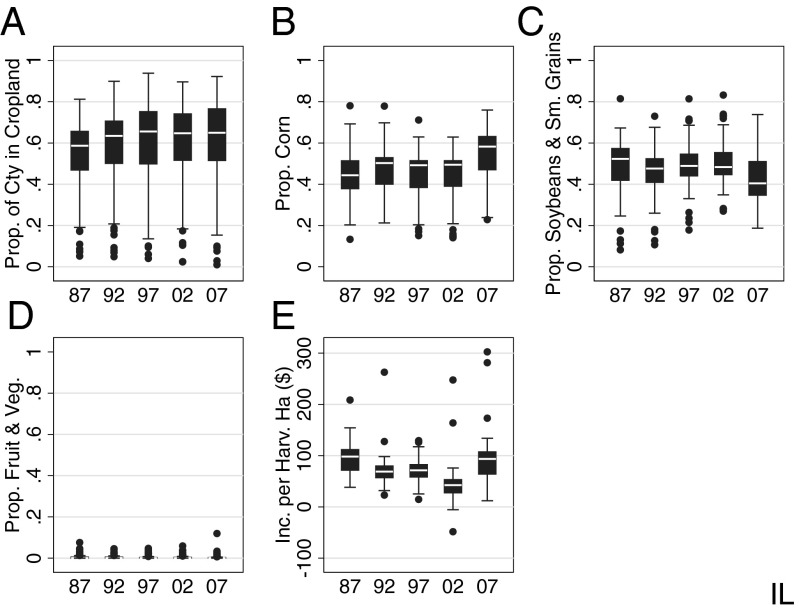
Fig. 1.
(A–E) Time trends for covariates for Illinois. County is abbreviated “Cty” and “Prop. (crop type)” indicates proportion of cropland in (crop type). Covariates remained similar over the period from 1987 to 2007 indicating that the counties were comparable over this time frame. Other states displayed a similar pattern over time.

