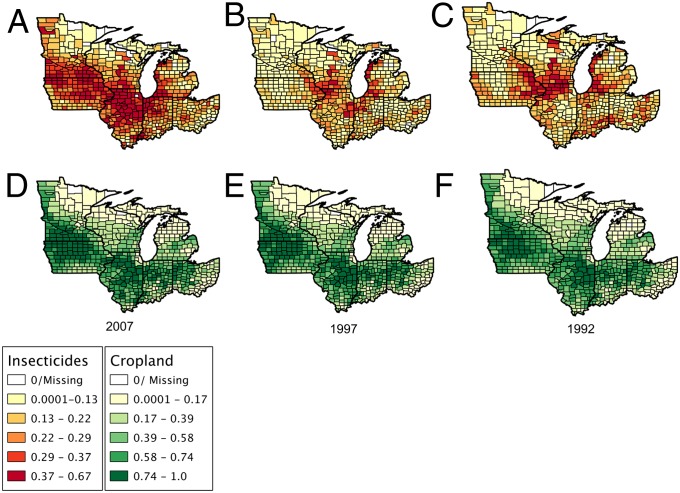
Fig. 3.
Map of proportion of cropland treated with insecticides (A–C) and proportion of the county in cropland (D–F) for 2007, 1997, and 1992 (see Fig. S3 for 2002 and 1987). The within- and between-county proportion of cropland treated with insecticides varies greatly between years. A positive correlation between cropland and insecticides is visually evident in 2007 and is absent in 1997 and reversed in 1992. The legend is based on 2007 quintiles with the range of the first and last quintile extended to incorporate the lowest (highest) values of the other years.

