Fig. 4.
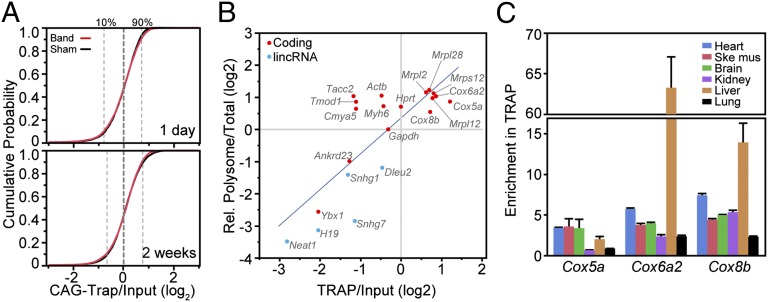
Analysis of ribosome binding using Rosa26CAG-TRAP. RNA-seq was performed on Rosa26CAG-TRAP heart 2 wk after sham or band operation. (A) Cumulative probability plot of the strength of ribosome binding (TRAP:input) for coding transcripts with RPKM >5 in sham or band. Most transcripts had TRAP:input ratios within a narrow range, and the distribution did not change with banding. (B) Comparison of sucrose gradient fractionation and TRAP measurement of translational activity. TRAP:input values are from RNA-seq, whereas polysome and total RNA measurements are from qRT-PCR and normalized to Gapdh. The best-fit line is shown. (C) qRT-PCR measurement of TRAP enrichment relative to Gapdh of selected mitochondrial protein transcripts in multiple tissues. These transcripts had high ribosome binding in heart and liver and lower ribosome binding in kidney and lung. Data are displayed as mean ± SEM.

