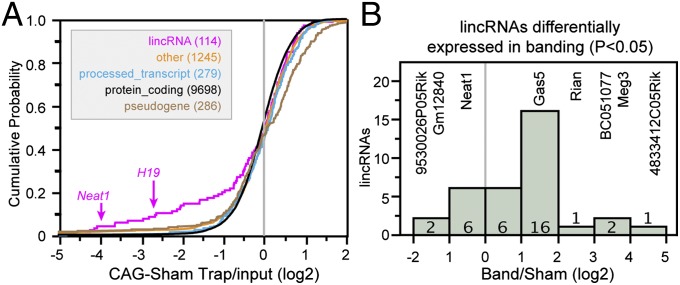
Fig. 5.
lincRNA ribosome binding. (A) Noncoding RNA ribosome binding profiles. Cumulative probability plot of ribosome binding strength by different noncoding RNA classes shows that lincRNAs are enriched for weak ribosome binding. Other noncoding RNA classes share ribosome binding profiles similar to coding transcripts. (B) Histogram showing that expression of a subset of lincRNAs changed significantly in input RNA between band and sham groups 2 wk after the operation. Transcripts with extreme up- or down-regulation are indicated by name.

