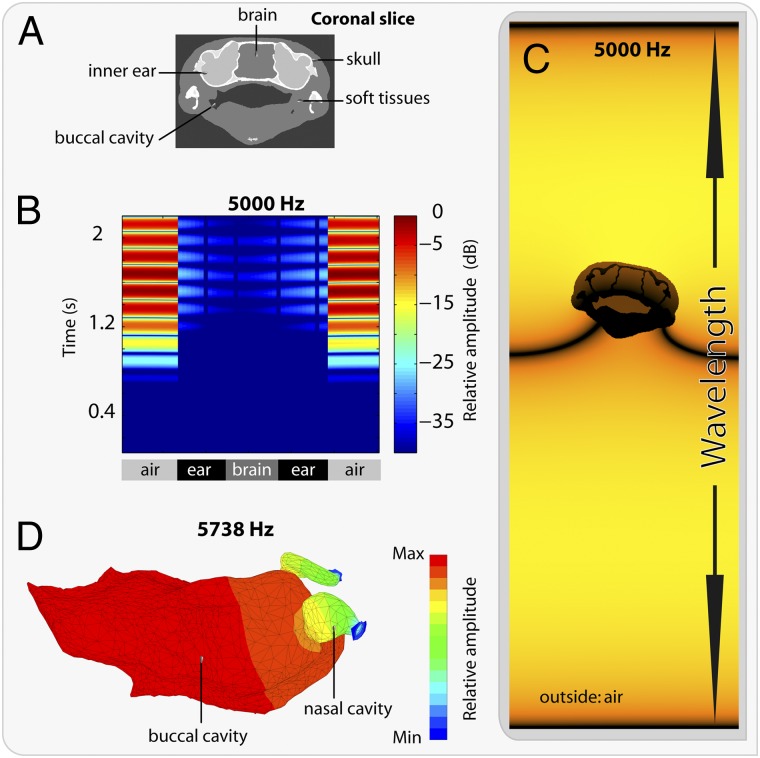
Fig. 3.
Bone conduction in S. gardineri. (A) Image segmentation at the level of the inner ears used for bone conduction simulations. (B) Graphic representation of the acoustic pressure as a function of time (ms) along a line crossing the two inner ears; color bar shows the relative pressure amplitude in decibels. (C) Snapshot of the simulated field: visualization of the propagation of a pressure wave (at 5 kHz) on a coronal section of the skull. (D) Finite-element acoustic mode of the oral cavity and the nasal cavities with open nostrils in a 3/4 dorsal view. Color scale represents the acoustic pressure in Pascals.

