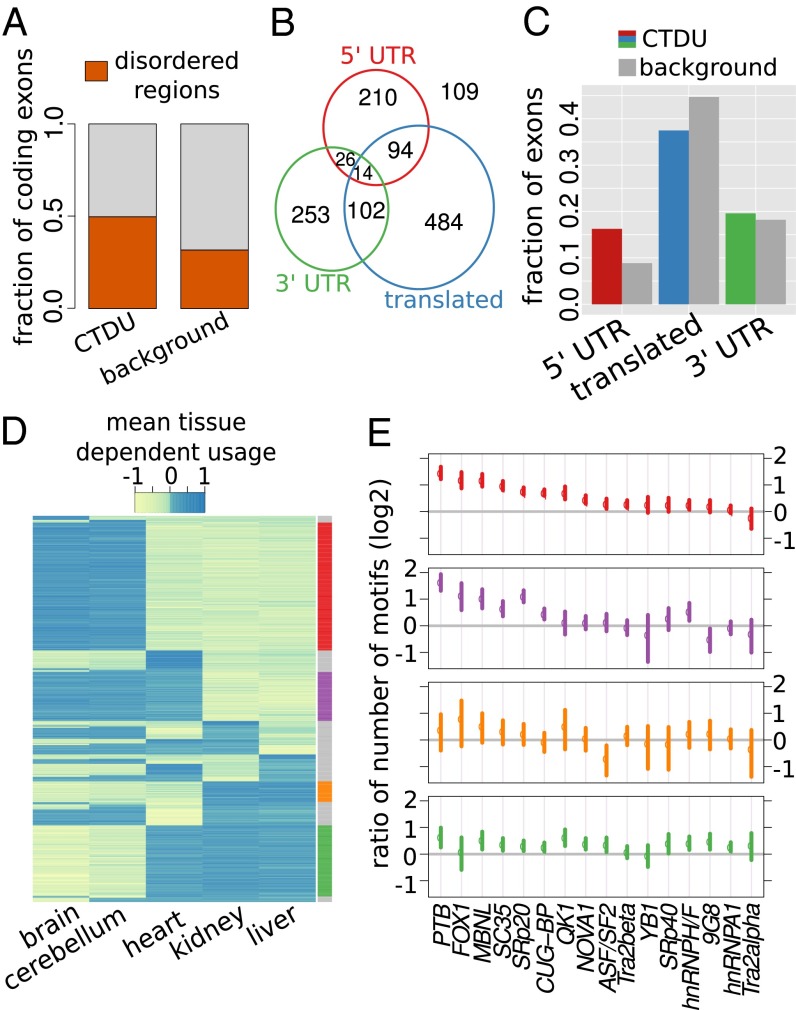
Fig. 3.
Features and tissue patterns of strictly CTDU exons. (A) Bar chart showing the fraction of exons of the strictly CTDU and background set of exons that overlap with regions predicted to code for natively disordered protein regions. (B) Venn diagram depicting a nonexclusive categorization of the strictly CTDU exons into translated, 3′-UTRs, and 5′-UTRs. (C) Bar chart indicating how the proportions of these categories compare between the strictly CTDU exons and background 2. (D) Heat map representation of the per tissue REUCs, obtained by averaging across species. Rows are ordered according to usage patterns. (E) Splicing factor motif enrichment in four exon clusters; the colors correspond to the clusters indicated in the right margin of D. The points indicate the mean value of the ratio to the background set of exons, the bars correspond to 95% confidence intervals estimated by bootstrapping.

