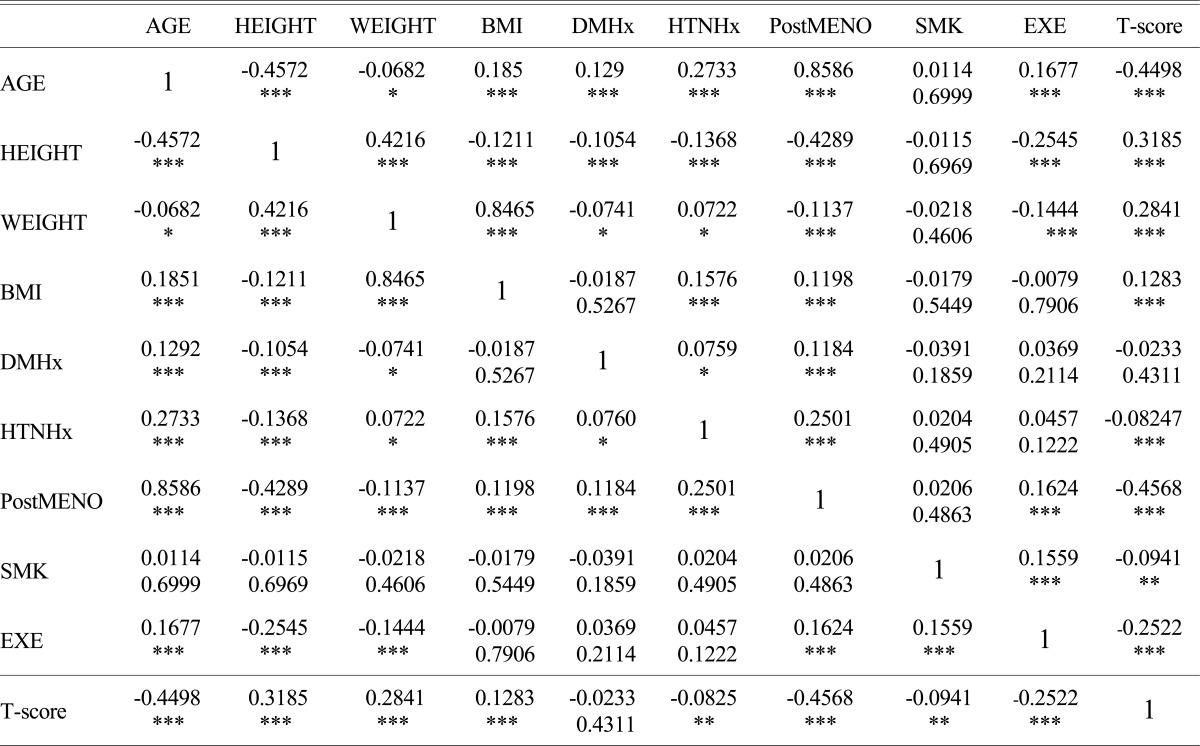
Table 3.
Correlation between T-score and other variables

*P < 0.05, **P < 0.01, ***P < 0.001
BMI, body mass index; DMHx, histroy of diabetes; HTNHx, history of hypertension; PostMENO, period after menopause; SMK, smoking; EXE, exercise
Correlation between T-score and other variables

*P < 0.05, **P < 0.01, ***P < 0.001
BMI, body mass index; DMHx, histroy of diabetes; HTNHx, history of hypertension; PostMENO, period after menopause; SMK, smoking; EXE, exercise