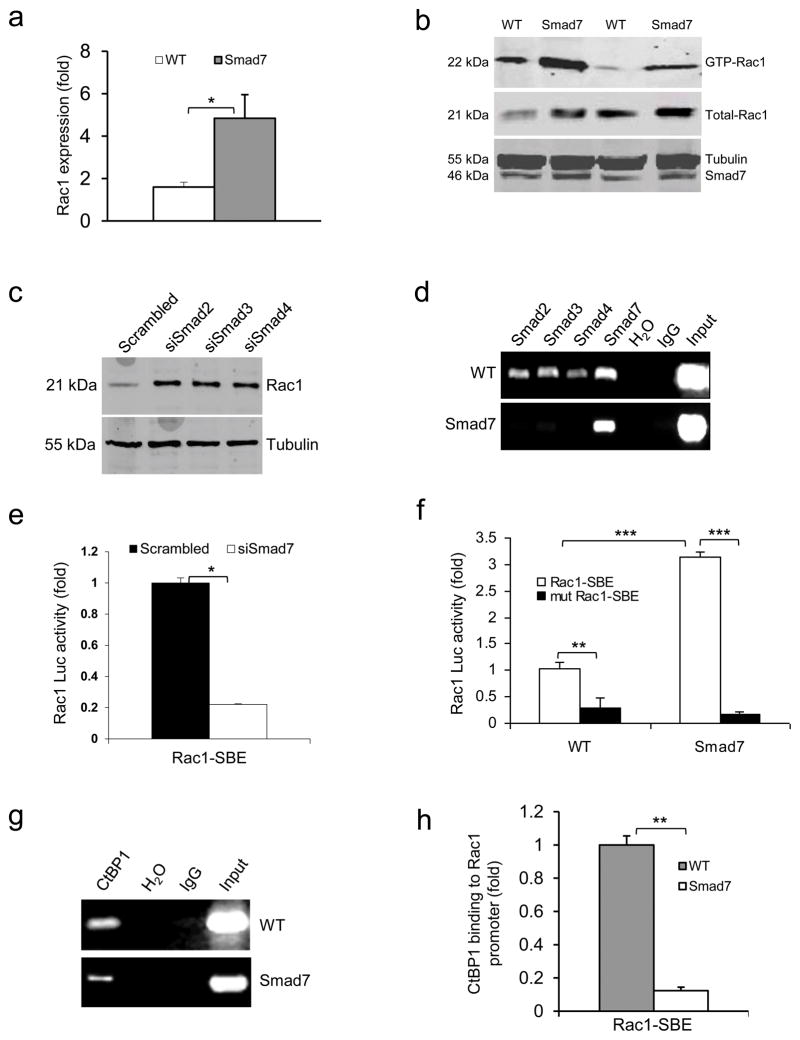
Figure 3. Smad7 leads to higher Rac1 expression by repressing individual Smad proteins and CtBP1 binding to the SBE of the Rac1 promoter.
(a) Rac1 mRNA levels (mean ± s.d.) in keratinocytes from WT and Smad7 transgenic mice. n = 4 per group. (b) Western blot analysis of GTP-bound Rac1 (GTP-Rac1) and total Rac1 in WT and Smad7 transgenic keratinocytes. Smad7 protein levels were determined by re-probing the tubulin western blot with an antibody to Smad7 (see an additional western blot and quantification in Supplementary Fig. 4a, b). (c) The amount of Rac1 protein after knocking down Smad2, Smad3 or Smad4 individually in human keratinocytes (See Supplementary Fig. 4c–e for Smad knockdown efficiencies). siSamd2-4, siRNAs specific for Smad2-4. (d) ChIP assay for Smad2, Smad3, Smad4, and Smad7 binding to the SBE -1.5 kb site of the Rac1 promoter in keratinocytes from WT and Smad7 transgenic mice. (e) Rac1 luciferase reporter assay in mouse keratinocytes. n = 6 per group. siSmad7, siRNA specific for Smad7; Rac1-SBE, the SBE-1.5 kb site of the Rac1 promoter. Data are the mean ± s.d. (f) Activities (mean ± s.d.) of Rac1-luc reporters containing SBE (Rac1-SBE) or mutant SBE (Mut Rac1-SBE) in keratinocytes from WT and Smad7 transgenic mice. n = 6 per group. (g) Images of ChIP assays of CtBP1 binding to the SBE-1.5 kb site of the Rac1 promoter in keratinocytes from WT or K5.Smad7 mice. (h) ChIP-quantitative PCR (mean ± s.d.) of CtBP1 binding to the SBE in g in keratinocytes from WT and Smad7 transgenic mice. n = 4 per group. *P < 0.05, **P < 0.01, ***P < 0.001 determined by two-tailed Student’s t test.

