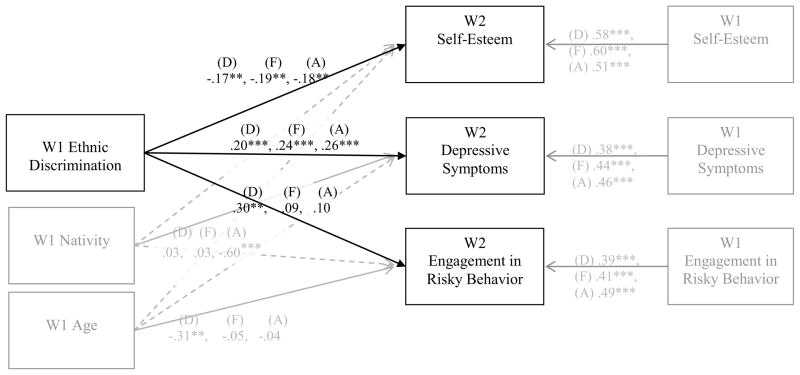
Figure 1.
Results from the Multiple Group Path Analysis.
Note. Standardized coefficients are shown. Control variables are presented in light grey. D = Diffuse, F = Foreclosed, A = Achieved. Covariation among the outcomes was modeled but is not shown here for brevity. Dashed lines represent non-significant pathways and solid lines represent significant pathways. *p < .05; **p < .01; ***p < .001.

