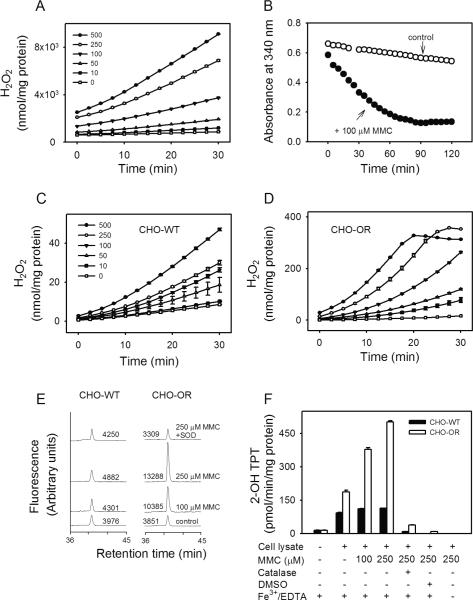
Figure 3. Redox cycling of MMC by recombinant cytochrome P450 reductase and lysates of CHO cells.
Panel A. Ability of rat recombinant cytochrome P450 reductase to redox cycle MMC. H2O2 production was assayed in enzyme reactions run in absence or presence of increasing concentrations of MMC using Amplex Red/HRP (mean ± SEM, n = 3). Panel B. Metabolism of NADPH in reactions containing rat recombinant cytochrome P450 reductase. NADPH (100 μM) in reaction mixes was assayed in the absence (open circles) or presence (closed circles) of 100 μM MMC. Panels C and D. MMC-induced H2O2 generation during redox cycling. MMC-induced H2O2 production in lysates from CHO-WT cells (Panel C) and CHO-OR cells (Panel D) was assayed in absence or presence of increasing concentrations of MMC (mean ± SEM, n = 3). Panel E. Generation of superoxide anion by MMC. Superoxide anion in enzyme assays was quantified by the formation of 2-hydroxyethidium from dihydroethidium as measured by HPLC with fluorescence detection. In some assays, SOD (350 U/ml) was added to inhibit the accumulation of superoxide anion. One representative experiment is shown. The numbers indicate the areas under each peak in arbitrary units. Panel F. Generation of hydroxyl radicals by MMC. Hydroxyl radicals in enzyme assays were quantified by the formation of 2-hydroxyterephthalate (2-OH TPT) from terephthalate (mean ± SD, n = 2). In some assays, catalase (400 U/ml) or DMSO (70 mM) was added to inhibit hydroxyl radical formation or its reaction with terephthalate, respectively. Note that the formation of hydroxyl radicals was dependent on the presence of redox active iron. All reactions contained 0.5 mM NADPH.

