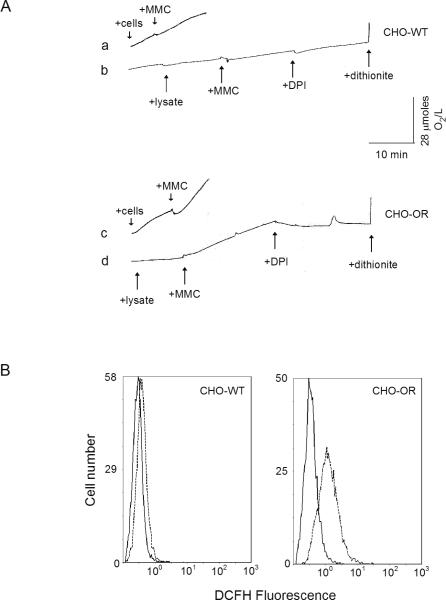
Figure 4. MMC-induced oxygen consumption and intracellular ROS production in CHO cells.
Panel A. Stimulation of oxygen consumption in CHO-WT and CHO-OR cells by MMC. A Clark oxygen electrode was used to measure oxygen utilization in CHO cell lysates (tracings b and d) and intact CHO cells (tracings a and c). The arrows show the addition of lysates or cells, 0.5 mM MMC, 10 μM DPI, and several grains of sodium dithionite. Panel B. ROS production in intact CHO-WT and CHO-OR cells. DCFH-DA was used to quantify intracellular ROS generation. Cells were incubated with 5 μM DCFH-DA at 37° C for 15 min, and then incubated in the absence (solid lines) or presence (dashed lines) of 0.5 mM MMC. After 3 h, cellular fluorescence was analyzed by flow cytometry. One representative experiment is shown. The mean fluorescence of the CHO-WT control peak was 0.32 ± 0.01 (mean ± SEM, n = 3), and 0.43 ± 0.03 after MMC treatment. For CHO-OR cells, the mean fluorescence of the control peak was 0.39 ± 0.00, and 1.50 ± 0.09 after MMC treatment.

