
Figure 1.
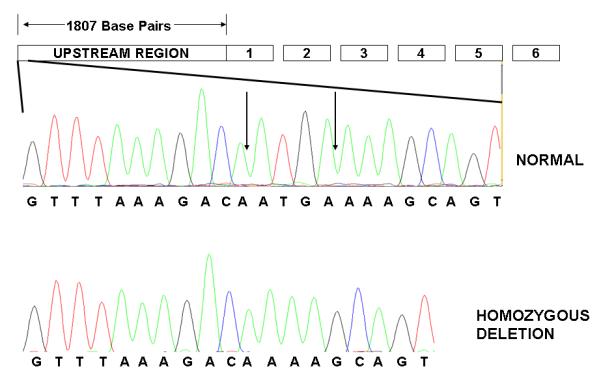
MSRA deletion c.-1796_-1793delATGA. A graphic representation of the MSRA gene is indicated (GenBank accession no.BC054033). Boxes 1-6 represent the MSRA exons. A region of 1807 bases upstream of the transcription start site is represented in the left most box. Within this upstream region, a sequence containing the 4 base pair deletion is expanded. The vertical arrows indicate the position of the 4 bases in an individual with the normal genotype. An individual homozygous for the deletion is shown at the bottom.