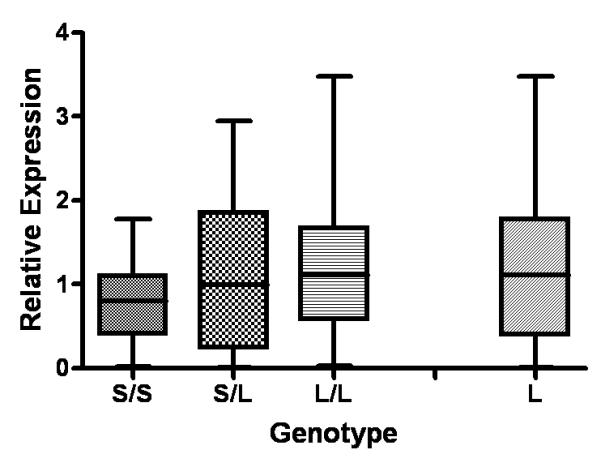
Figure 2.

Relative expression of the MSRA gene in relation to MSRA c.-1796_-1793delATGA genotype. S/S = individuals homozygous for the deletion, N=21; S/L = heterozygous, N= 21; L/L= homozygous normal, N= 24. L= high expressing genotypes (L/L and L/S), N= 45. Each box displays the mean (black bar), the 25th and the 75th percentiles (the lower and the upper edges of the box, respectively), and the extreme values. P = 0.0135 comparing the L and S/S groups, and P = 0.0294 comparing the L/L and S/S groups (two-tailed student’s t-test).
