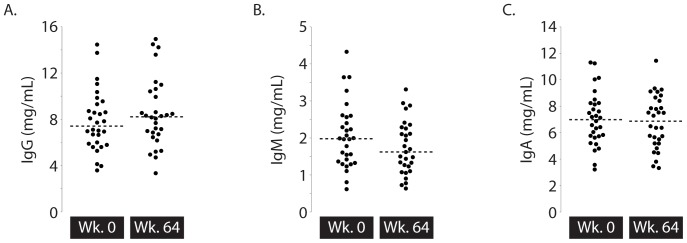
Figure 3. Changes in overall immunoglobulin levels.

Overall levels of immunoglobulin (A = IgG, B = IgM, C = IgA) were measured in macaques (n = 30) at two time points – week 0 (prior to-vaccination and SIV challenge) and week 64 (after vaccination and SIV challenge). Dashed lines indicate the median values for each time point. P-values for comparison of the two time points were calculated with the Mann-Whitney test. Additionally, histograms show the fold changes in overall immunoglobulin (D = IgG, E = IgM, F = IgA) occurring after vaccination and SIV challenge.
