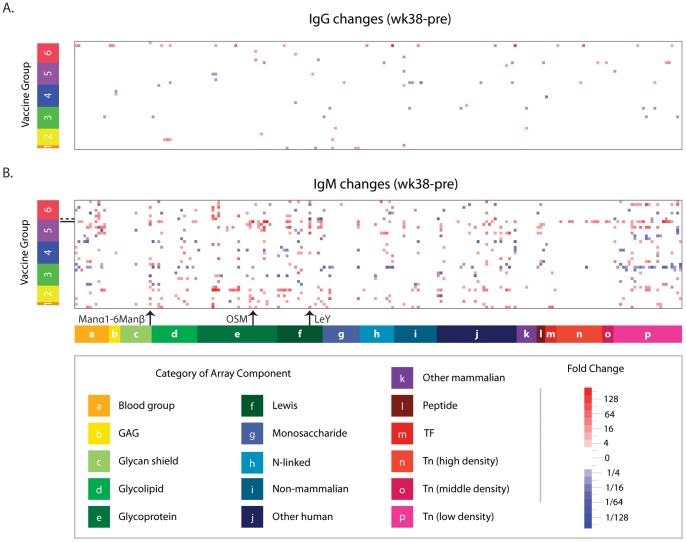
Figure 4. Post-vaccination changes in anti-glycan antibodies.
Heat map showing changes in IgG (A) and IgM (B) circulating anti-glycan antibodies that occurred after vaccination (wk 38–wk 0). Rows correspond to individual macaques (n = 38) sorted by vaccine groups described in Table 1. Columns correspond to glycans grouped according to glycan family. Red indicates increases, and decreases are shown in blue. Non-significant changes (<4×) are white. As indicated by the arrows, Manα1-6Manβ had the most number of antibody changes, OSM had the largest increase in antibody levels, and LeY had the largest decrease. The dashed horizontal line marks the macaque with the large decline in anti-LeY IgM levels, and the solid line indicates the macaque with the largest OSM increase.

