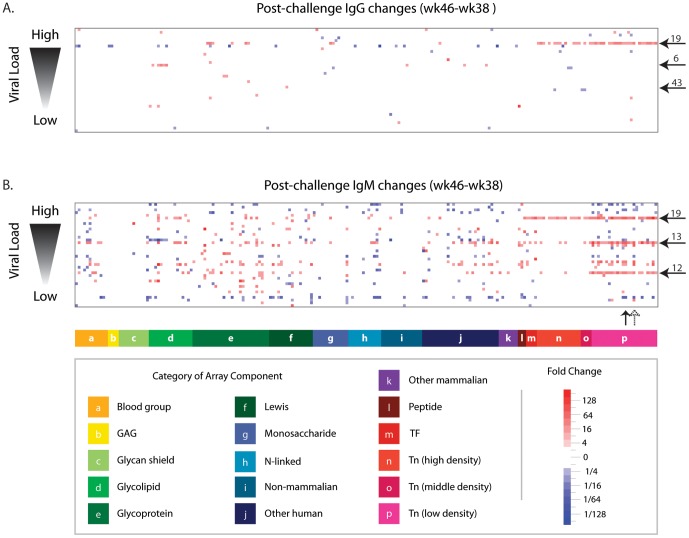
Figure 5. Early changes in anti-glycan antibody levels after SIV infection.
Heat map showing changes in IgG (A) and IgM (B) circulating anti-glycan antibodies that occurred after vaccinated macaques were challenged with SIV (wk 46–wk 38). Rows correspond to individual macaques (n = 38) sorted according to their ability to control SIV infection, as indicated by viral load measured at week 64 Columns are glycans grouped by category. Non-significant changes (<4×) have been colored white. Five macaques (animals 6, 12, 13, 19, and 43) with the most consistent Tn responses are marked with horizontal arrows. Vertical arrows indicate two Tn glycopeptides (solid arrow is Ac-S-Tn(Thr)-S-G-04 and dashed arrow is Ac-S-Tn(Thr)-V-G-04), which had changes occurring in the largest number of macaques (32%).

