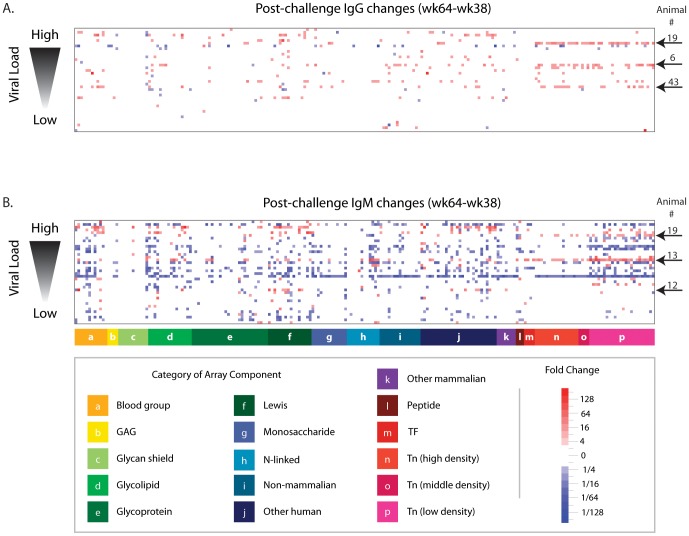
Figure 6. Later changes in anti-glycan antibody levels after SIV infection.
Post-infection changes in anti-glycan antibody levels were repeated for overall week 64 (22 weeks after challenge). Heat map showing changes in circulating IgG (A) and IgM (B) anti-glycan antibodies that occurred after vaccinated macaques were challenged with SIV (wk 64–wk 38). Rows correspond to individual macaques (n = 38) sorted according to their ability to control SIV infection, as indicated by viral load measured at week 64. Columns are glycans grouped by category. White indicates non-significant changes (<4×). Five macaques (animals 6, 12, 13, 19, and 43) with the most consistent Tn responses are marked with arrows.

