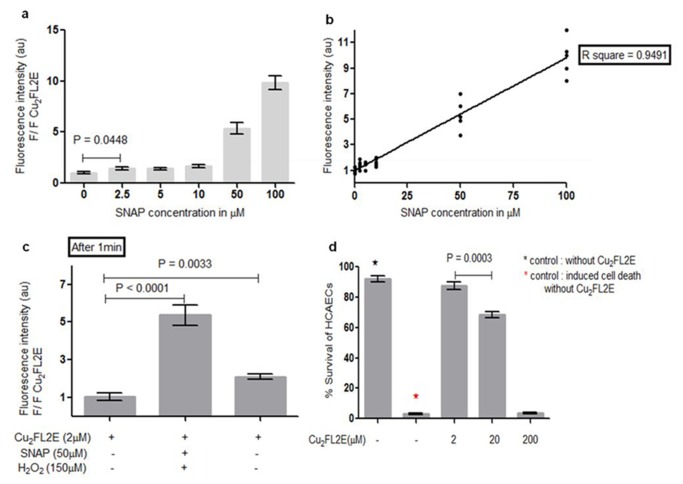
Figure 2. Sensitivity and specificity of Cu 2FL2E.
(a) Fluorescence response of Cu 2FL2E (2 µM) to various concentrations of NO after 1 min of SNAP administration. n = 5 for each concentration, (b) Linear regression curve plotted from (a), (c) Fluorescence response of Cu 2FL2E to NO (50 µM SNAP in PBS at 37°C, pH 7.4) and H2O2 (150 µM). The spectra were obtained 1 min after SNAP addition n = 5. Error bars indicate s.d., (d) Cytotoxicity assay with different concentrations Cu 2FL2E.

