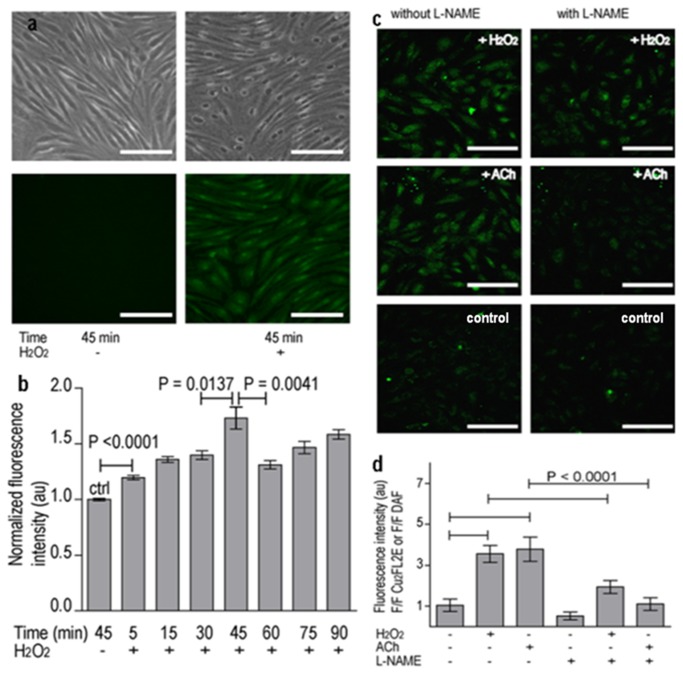
Figure 3. Detection of NO with Cu 2FL2E produced by endothelial cells in vitro.
(a) NO detection in porcine aortic endothelial cells (PAECs); Left: 45 min incubation of Cu 2FL2E (20 µM). Right: 45 min incubation of Cu 2FL2E (20 µM) and H2O2 (150 µM). Top: bright-field images of cells. Bottom: fluorescence images of cells. Scale bar is50 µm. (b) Quantification of fluorescence intensity plotted against incubation time. (c) Detection of NO with Cu 2FL2E in HCAECs cells, with or without NO-inhibitor (L-NAME). Shown are the fluorescence images after 45min co-incubation of the probe (Cu 2FL2E =2 µM) with H2O2 (150 µM), L-NAME (100 µM), and/or ACh (10 µM) according to scheme. Scale bar is 75 µm. (d) Quantification of fluorescence intensity from (c) plotted against each condition mentioned in (c) (n = 5). Error bars indicate s.d.

