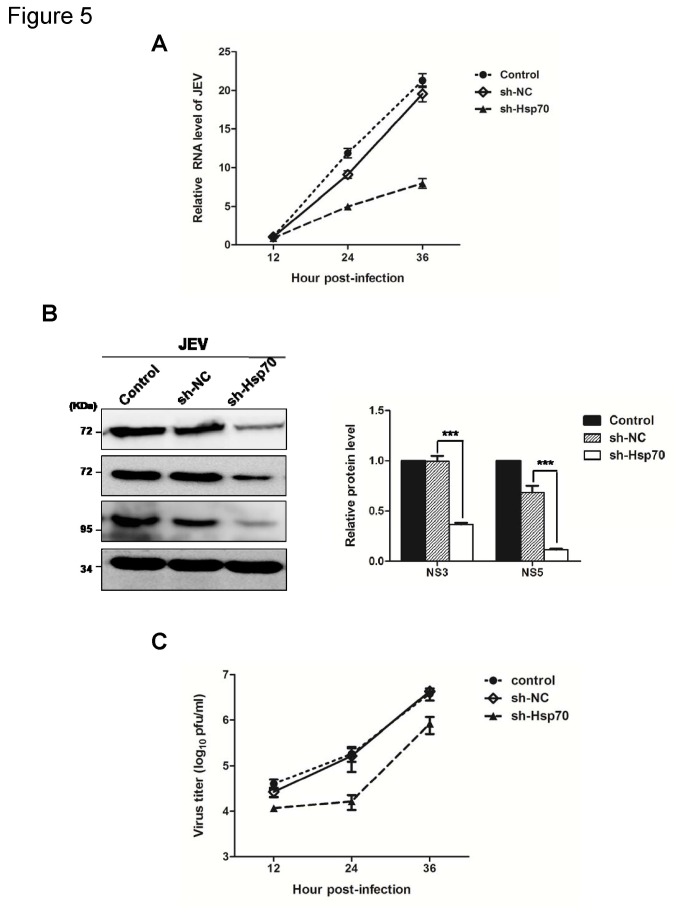
Figure 5. Knockdown of Hsp70 inhibits JEV propagation.
293T cells were not transfected (control) or were transfected with sh-NC or sh-Hsp70. After 24 h, cells were infected with JEV at an MOI of 1.0. (A) Cells were harvested at 12, 24, 36 h p.i. respectively. Total cellular RNA was extracted and subjected to RT reaction. The level of JEV RNA (NS5) was determined by real-time PCR. The results shown are from three independent assays, with the error bars representing the standard deviations. (B) Cell lysates collected at 36 h p.i. were subjected to immunoblotting with mouse MAbs to JEV NS3, NS5, Hsp70 and GAPDH. The protein levels were quantified by immunoblot scanning and normalized with respect to the amount of GAPDH (right panel). The results shown are from three independent assays, with the error bars representing the standard deviations (***, P < 0.0001, student’s t-test). (C) Culture supernatants were harvested at 12, 24, and 36 h p.i. and infectious titers were determined by plaque assays in BHK cells. Error bars represent the standard deviations of results from three independent assays.

