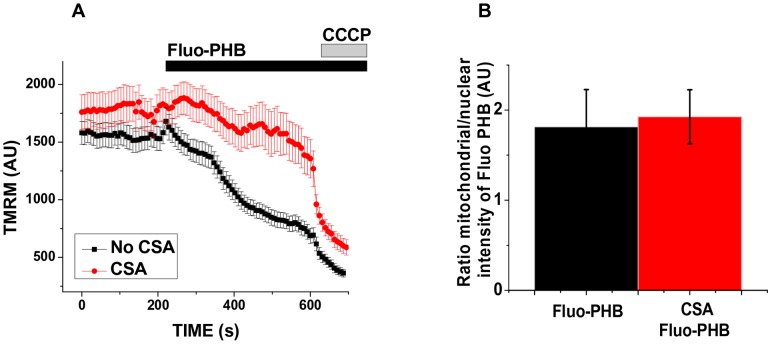
Figure 4. CSA delays fluo-PHB induced mitochondrial membrane depolarization.
A) HeLa cells were loaded with 25 nM TMRM and treated (red trace, n = 12) or not (black trace, n = 20) with CSA (1 µM); this was followed by the addition of fluo-PHB (18 ng/ml). Cells were imaged with a laser confocal microscope. Traces show TMRM intensity collected from the mitochondrial regions. B) fluorescence intensity ratios in the presence of fluo-PHB between nuclear and mitochondrial regions of HeLa cells treated with CSA and non-treated control cells. (n = 40 for each group of cells);

