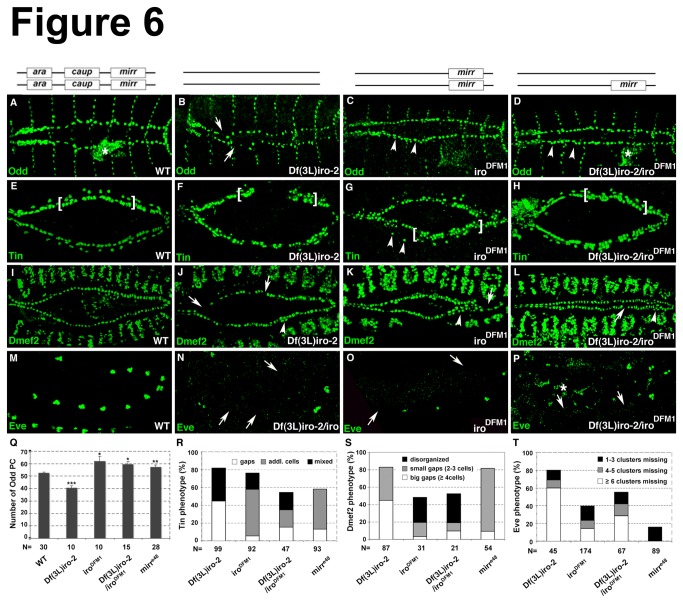
Figure 6. Heart phenotypes embryos mutant for Iro-C.
The genetic background is depicted in the drawing above each column. The boxes illustrate the presence of the indicated factor. (A-D, Q) Loss of ara/caup results in an increase in Odd-expressing pericardial cells (arrowheads in C, D), whereas embryos carrying the larger deletion exhibited a reduced number of Odd-positive cells (arrows in B). Asterisks in A and D demarcate Odd expression in the gut. Q) The numbers of Odd-positive cells in each Iro-C mutant were statistically tested for significant differences from wild-type embryos using the Mann-Whitney test (* p < 0.01, ** p < 0.001, *** p < 0.0001). Odd-positive cells that are part of the lymph glands were not included in the counting. (E-H) Iro-C mutants exhibit an abnormal pattern of Tin-expressing cells. The brackets highlight some hemisegments in which the normal pattern of four Tin-positive myocardial cells and two Tin-expressing pericardial cells is disorganized. The arrowheads in G point to Tin-positive cells that are detached from the heart. (I-L) Phenotypes for Dmef2 varied in their severity and included loss of Dmef2-positive cells (arrows) as well as misalignment of the two myocardial cell rows (arrowheads). (M-P) Loss of Iro-C results in a reduction of Eve clusters. (R-T) Quantification of the phenotypes observed. The bar graphs depict the percentage of embryos that exhibited a particular phenotype for the indicated marker. All embryos are oriented with the anterior to the left. Dorsal views of embryos at stages 14-16 are shown in A-L. Lateral views of embryos at stages 10/11 are shown in M-P.

