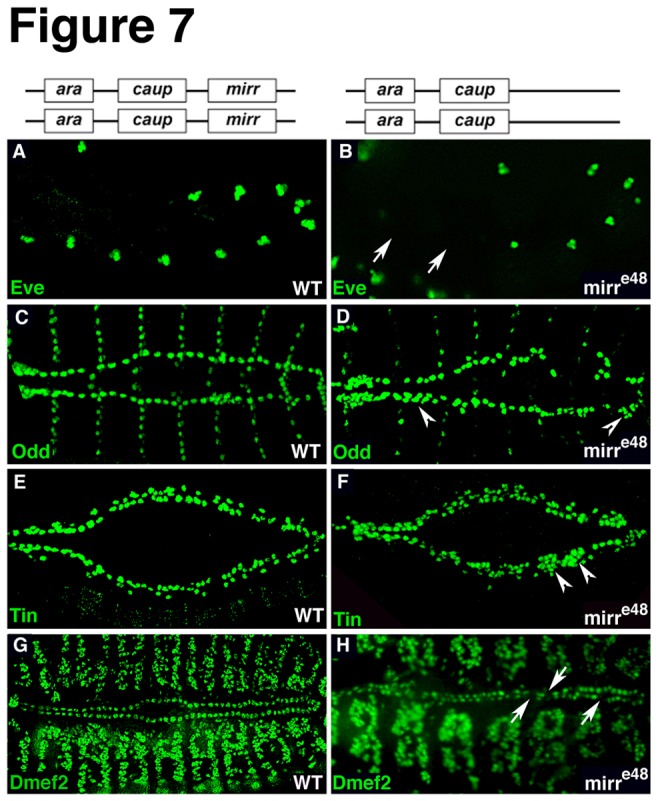
Figure 7. Heart phenotypes in embryos mutant for mirr.

(A, B) mirr mutants have a reduced number of Eve clusters (arrows). (C, D) The number of Odd-expressing pericardial cells is increased in mirr mutants (arrowheads). (E, F) mirr mutants are characterized by an increased number of Tin-positive cells (arrowheads). (G, H) Myocardial Dmef2-expressing cells are slightly reduced in mirr mutants (arrows). Quantification of the phenotypes is included in the bar graphs shown in Figure 6 Q-T.
