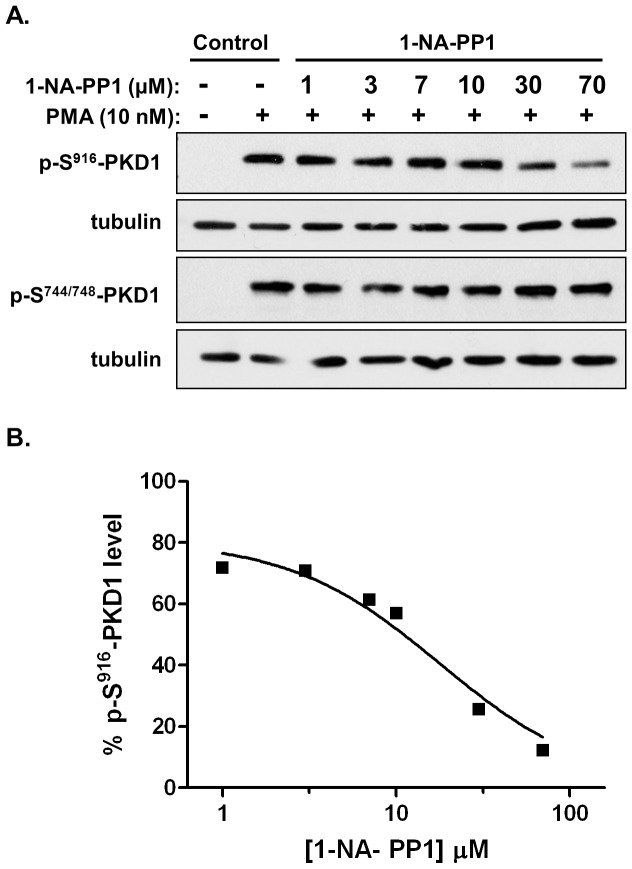
Figure 5. Inhibition of PMA-induced activation of endogenous PKD1 by 1-NA-PP1 in cells.
A. LNCaP cells were pretreated with different doses of inhibitors for 45 min, followed by PMA stimulation at 10 nM for 20 min. Cell lysates were subjected to immunoblotting for p-S916-PKD1 and p-S744/748-PKD1. Tubulin was blotted as loading control. The experiment was repeated three times and the representative blots are shown. B. Determination of the IC50. Western blots were quantified using densitometry analysis. The data were plotted and IC50 values were derived the concentration-response curves using GraphPad. One of the three concentration-response curves was shown.

