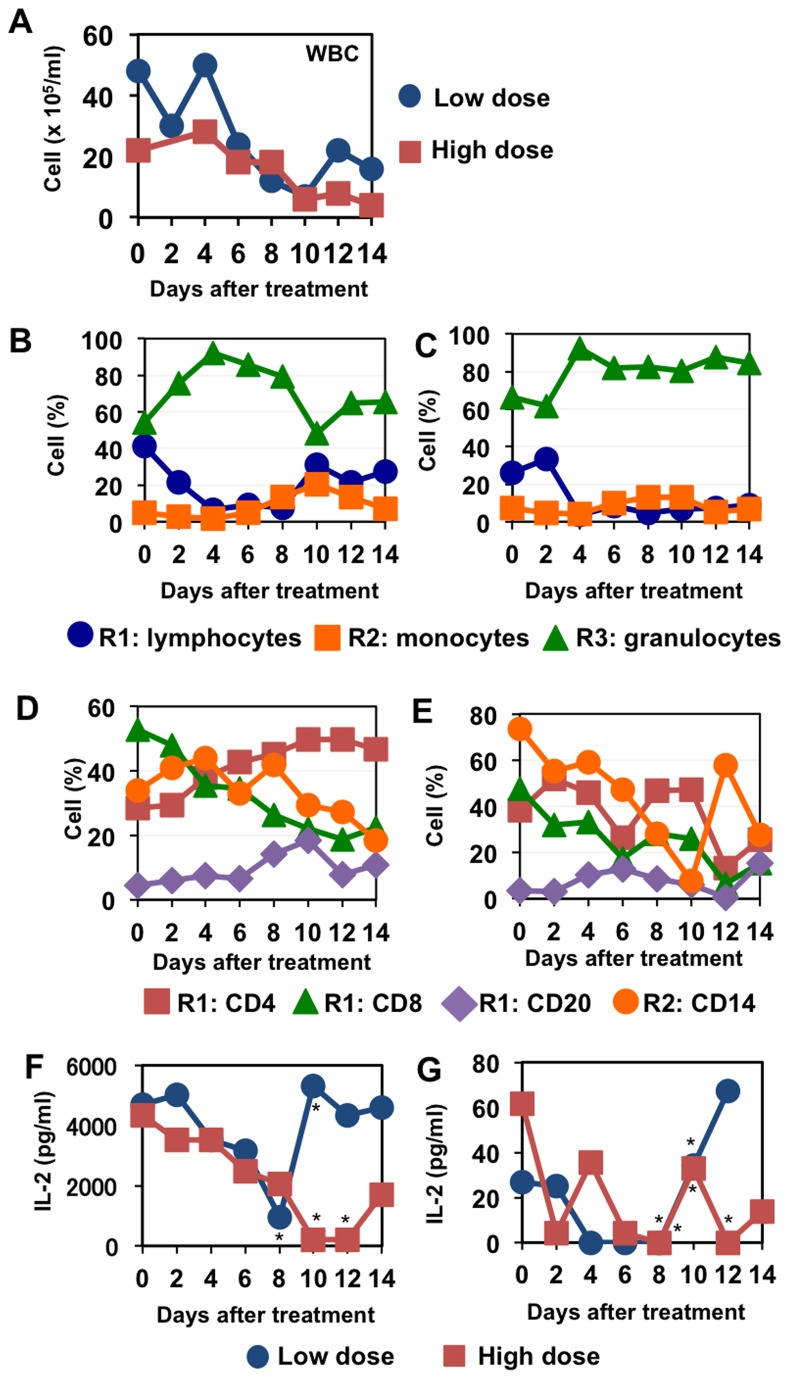
Figure 1. Blood cell population and IL-2 production after immunosuppression.
Peripheral blood was collected on the indicated days after the first administration of CP and CA. (A) The number of white blood cells was counted using a microscope and a hemocytometer. (B, C) The percentage of white blood cell population was calculated on the basis of forward and side scatter scales (FSC and SSC) in flow cytometric analysis. Representative profiles of flow cytometric results are shown in Figure S1. Lymphocytes, monocytes, and granulocytes were determined as populations in R1 (low FSC/low SSC), R2 (high FSC/low SSC), and R3 (high FSC/high SSC), respectively. (D, E) The percentages of CD4+, CD8+, CD20+, and CD14+ cells were determined with a flow cytometer. The percentages of CD4+, CD8+, and CD20+ cells are indicated as the percentages in R1. The percentages of CD14+ cells are indicated as the percentages in R2. B, D: a monkey treated with low CP and CA, C, E: a monkey treated with high CP and CA. (F, G) Peripheral blood cells were culture with PMA+ionomycin (F) or anti-CD3 + anti-CD28 + anti-CD49d antibody (G) for 24 h. IL-2 in supernatants was measured with ELISA. Results are shown as averages of triplicate cultures except asterisked points in which results were calculated from less than three wells since sufficient cells to make triplicate cultures were not collected.

