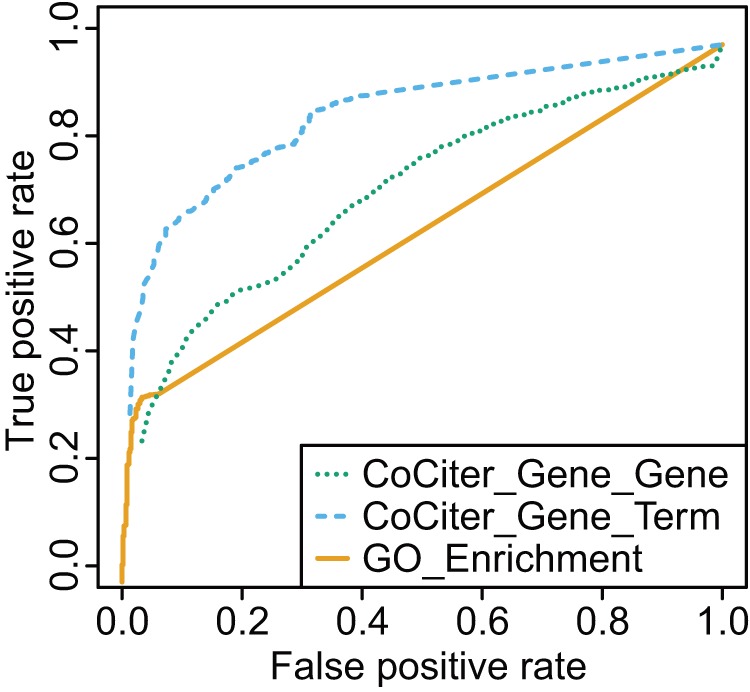
Figure 2. ROC curves of CoCiter and GO enrichment analysis by Fisher exact test.

The analysis was based on 2097 gold standard positives (GSP) and 603 gold standard negatives (GSN) selected from the overlapping and non-overlapping GO and KEGG annotations, respectively (Supplemental Methods in File S1). The curve for CoCiter_Gene_Gene association function was obtained by using the KEGG genes and GO genes as input, while that for CoCiter_Gene_Term association function was obtained using the KEGG pathway keywords as terms and GO genes as input.
