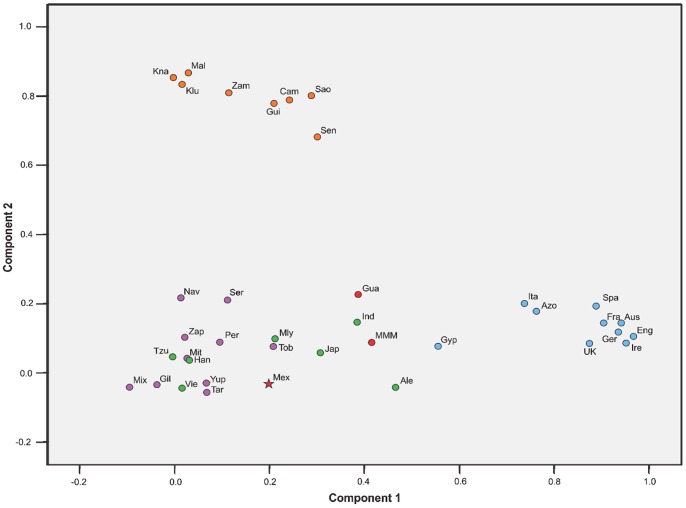
Figure 1. Principal component analysis (PCA) plot reveals a close genetic relationship of Mexican admixed individuals from Mexico City to Native American groups.
Orange dots refer to African populations. Blue dots represent European samples. Green dots correspond to Asian human groups. Native American populations are represented by purple dots. Red figures are admixed populations from Mexico, with a star locating our Mexico City admixed sample. Proper references of each population group included in the analysis are given in the Materials and Methods section. Ire: Ireland, Eng: England, Ger: Germany, Aus: Austria; Spa: Spain, Ita: Italy, UK: United Kingdom, Fra: France, Gyp: Gypsy, Azo: Azores, Sao: São Tomé Island, Cam: Cameroon, Mal: Mali, Zam: Zambia, KLu: Luo from Kenia, KNa: Nandi from Kenia, Sen: Senegal, Gui: Guinea Bissau, Ale: Aleut from Bering Island, Jap: Japan, Tzu: Taiwan, Han: south China, Ind: north India, Mly: Malasya, Vie: Vietnam, Tar: Tarahumara, Gil: Native Americans from Gila River, Yup: Yu’pik from Alaska, Mit: Mixtec from Oaxaca, Zap: Zapotec from Oaxaca, Mix: Mixe from Oaxaca, Ser: Seri from Sonora, Nav: Navajo from New Mexico, Uro: Uro from Titikaka Lake, Tob: Toba from Rosario, MMM: “Mexican Mestizo” sample, Gua: Guadalajara City, Mex: this study.

