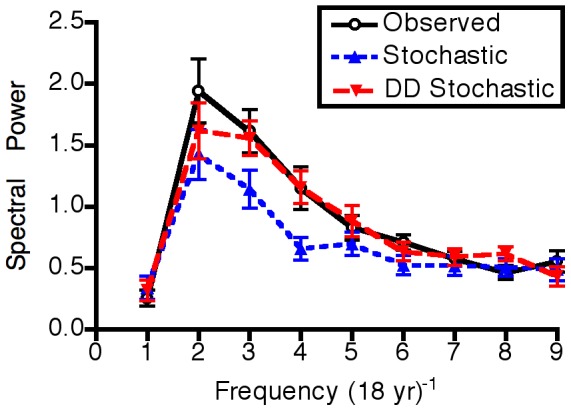
Figure 5. Spectral analysis of observed data (Fig. 1) and of model results both with (Fig. 4) and without (Fig. 7) density-linked stochasticity.

The graph depicts the relative contribution of trigonometric functions of different recurrence frequencies spanning the 17-year observation period. Error bars represent one standard error.
