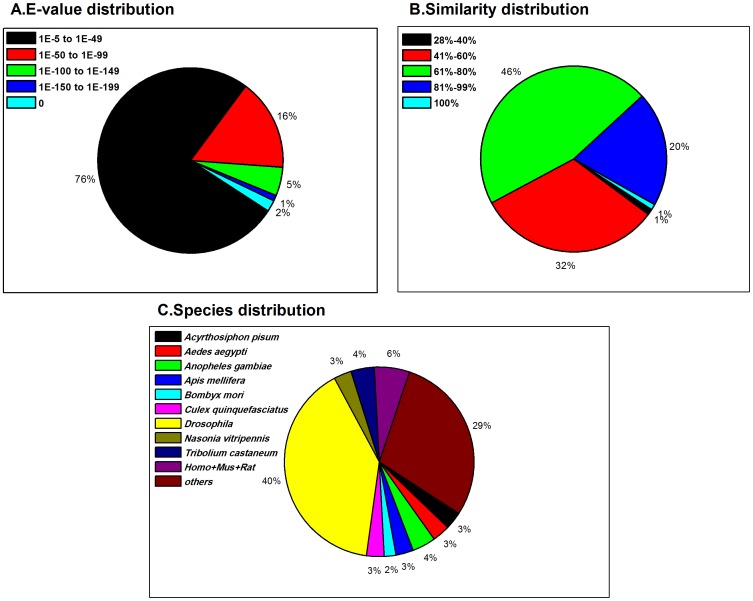
Figure 2. Homology analysis of Chilo suppressalis unigenes.
(A) E-value distribution of BLAST hits for each unique sequence with cut-off E-value = 1.0E-5. (B) Similarity distribution of the top BLAST hits for each sequence. (C) Species distribution of the BLASTX results. We used the first hit of each sequence for analysis. Homo: Homo sapiens; Mus: Mus musculus; Rat: Rattus norvegicus. Each slice of the pie-charts represents proportions of the total sequences.

