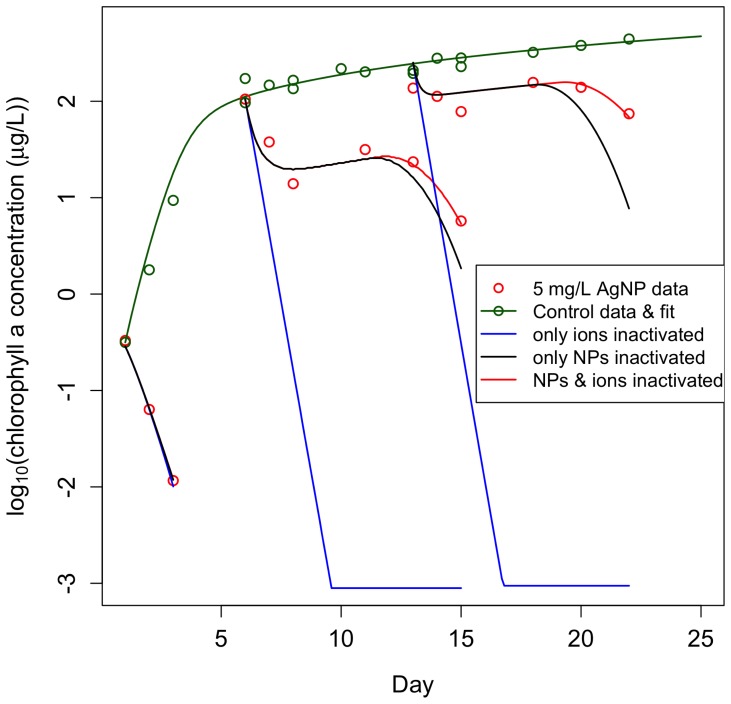
Figure 5. Model predictions with inactivation mechanisms of DOC on AgNP and Ag+ separately and in unison.
Model simulations demonstrate the significance of DOC inactivation of AgNPs and Ag+ (red lines). The simulations suggest that DOC mitigation of nanotoxicity provides a much stronger feedback than mitigation of ionic toxicity: while the model without ionic mitigation (black lines) generally follows the observations and only predicts the second dip slightly sooner, the model without AgNP inactivation (blue lines) radically departs from the observations, with the population going extinct by day three of the exposure.

