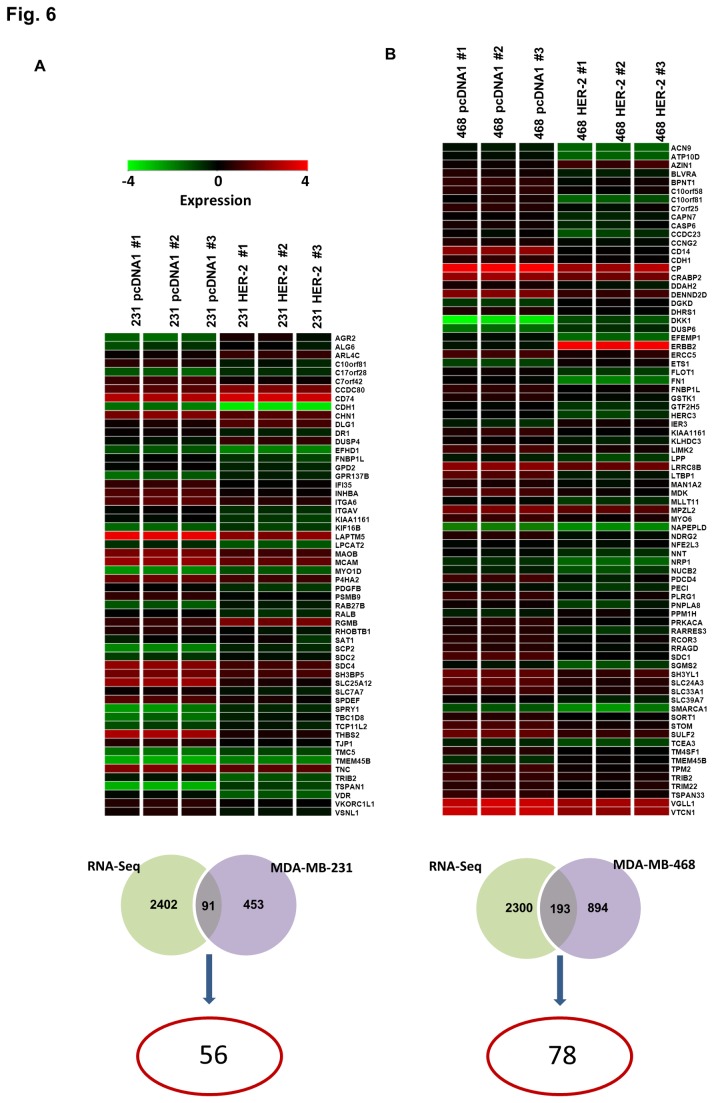
Figure 6. Comparison of microarray data from isogenic clones and RNA-seq data from patient samples with similar breast cancer subtypes.
A) Comparison of differentially expressed genes obtained from RNA-seq data from patient samples and microarray data in A) MDA-MB-231 background B) MDA-MB-468 background. The overlap in the Venn diagram show common genes between the comparisons and the number circled in red indicates the candidates that show same trend of regulation in both microarray and RNA-seq dataset (shown as a heatmap).

