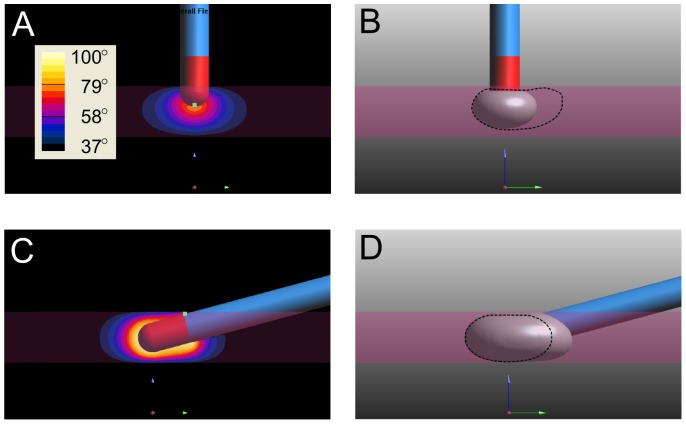
Figure 3. Temperature Distribution Map and Resulting Lesion Volume.
For a catheter at 1.6°, temperature (A) and lesion (B) are shown after ablating for 60 s. Dashed volume depicts resulting volume from catheter at 1.6 mm depth at 15° after ablating for 60 s. Temperature distribution map (C) and lesion volume (D) with catheter at 3.2 mm penetration depth and 15° after ablating for 19 s. Dashed volume depicts resulting volume from catheter at 3.2 mm depth and 90° after ablating for 60 s. Legends in A and C show temperature in degrees Celsius.

