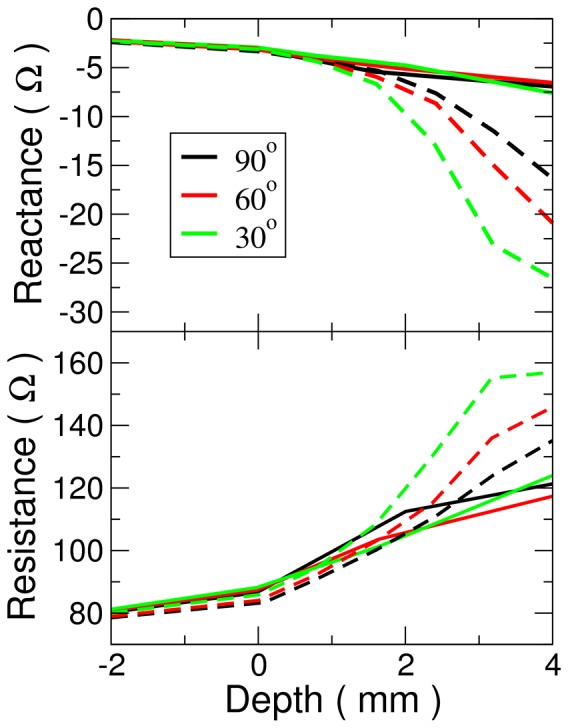
Figure 6. Comparison of biological and simulated impedance.

(Top) Electrical reactance as a function of insertion depth. (Bottom) Electrical resistance as a function of insertion depth. Simulated values are given by dashed lines while solid lines indicate biological results. Color indicates the same angle for both simulations and biological experiments.
