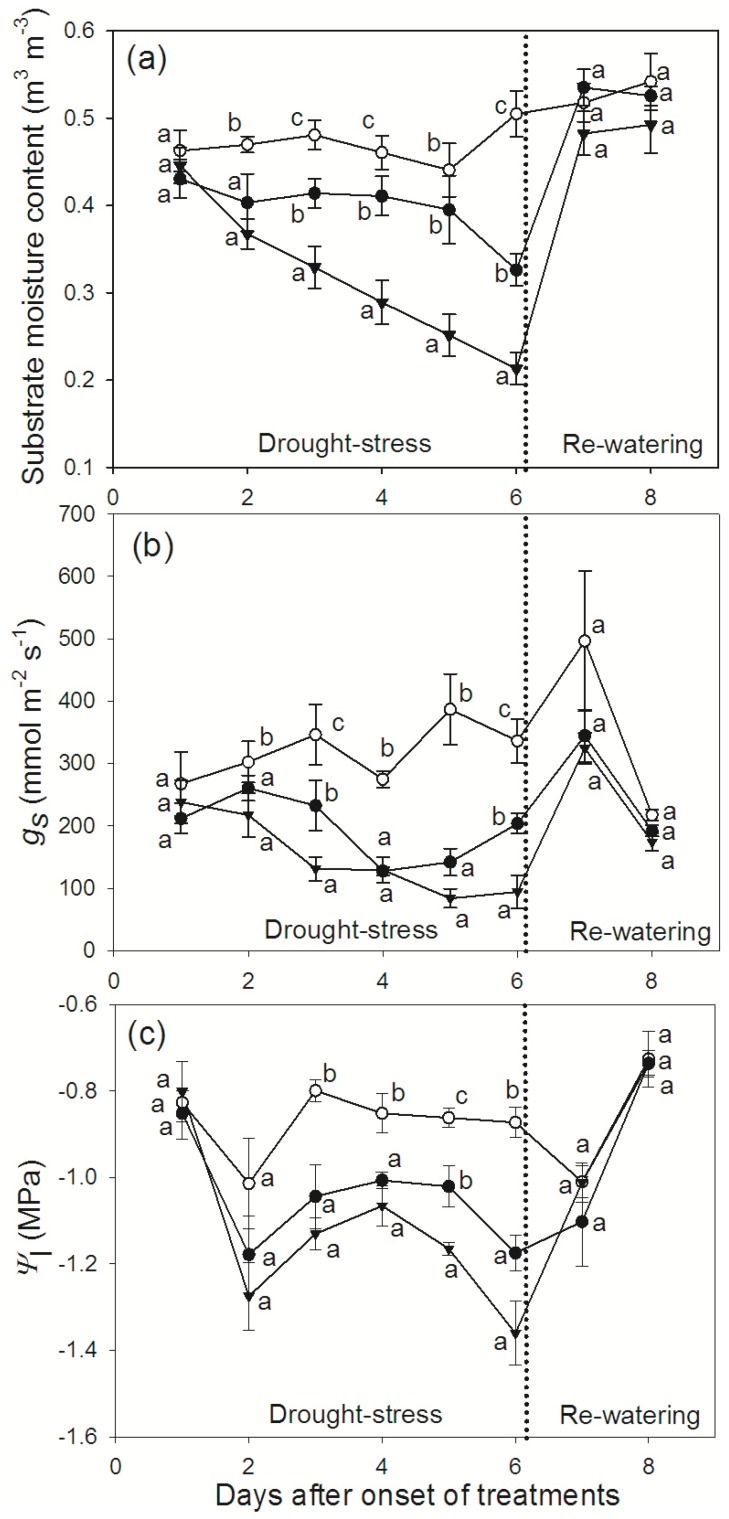
Figure 4. F. vesca water relations under different levels of water-stress.
Plots showing (a) substrate moisture content, (b) stomatal conductance and (c) leaf water potential under different levels of water-stress. Open circles – control plants; filled circles – plants receiving 25% of the control irrigation; filled triangles – plants with no irrigation. Data are means ± SE, n = 4 plants. Different letters denote statistically significant differences on a given day, determined by LSD following one way ANOVA (P<0.05).

