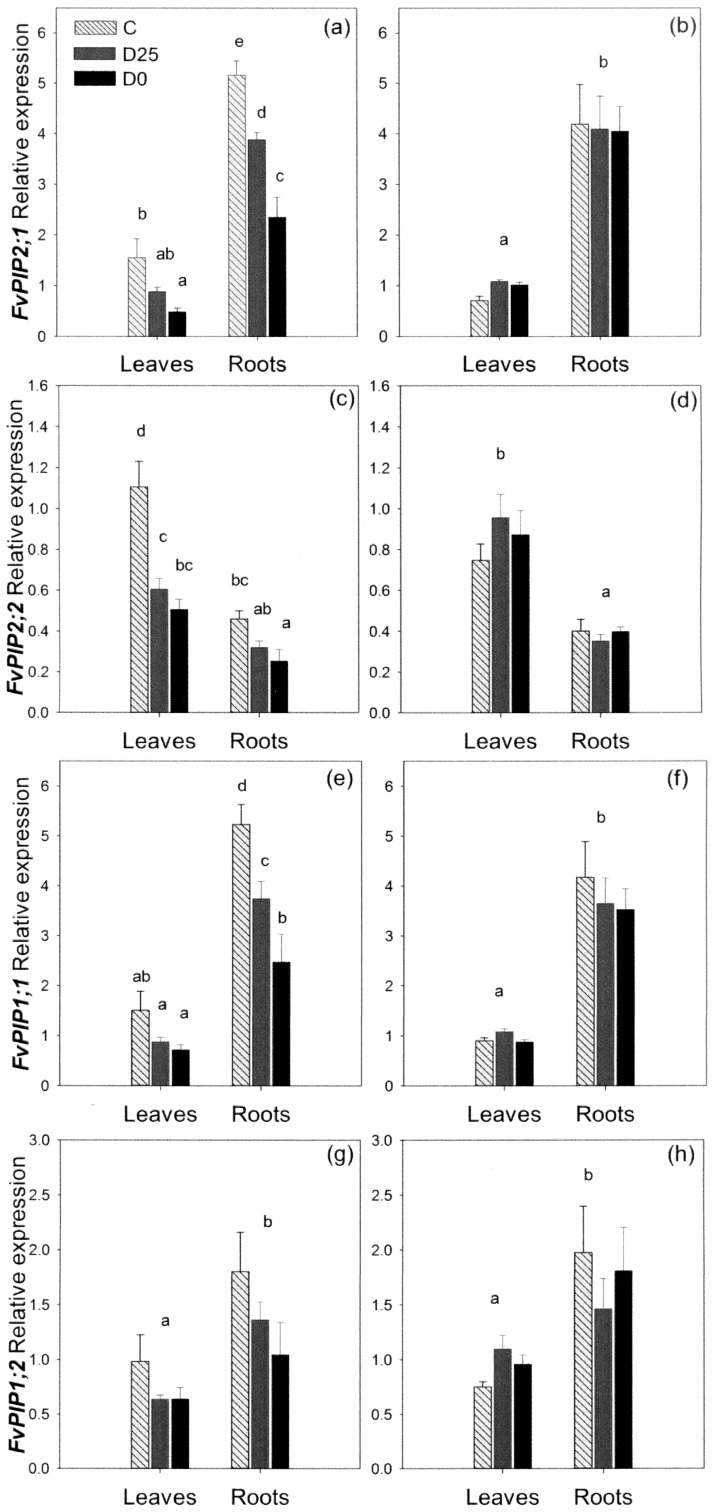
Figure 5. Relative PIP expression in leaves and roots of F. vesca under different levels of drought stress.
Expression of four F. vesca PIP aquaporin genes after six days of drought stress (a, c, e, g) and upon re-watering (b, d, f, h). C – control plants; D25– plants receiving 25% of the control irrigation; D0 − plants with no irrigation. Data are means+SE, n = 4 plants. Different letters denote statistically significant differences within each time point determined by LSD following one way ANOVA (P<0.05).

