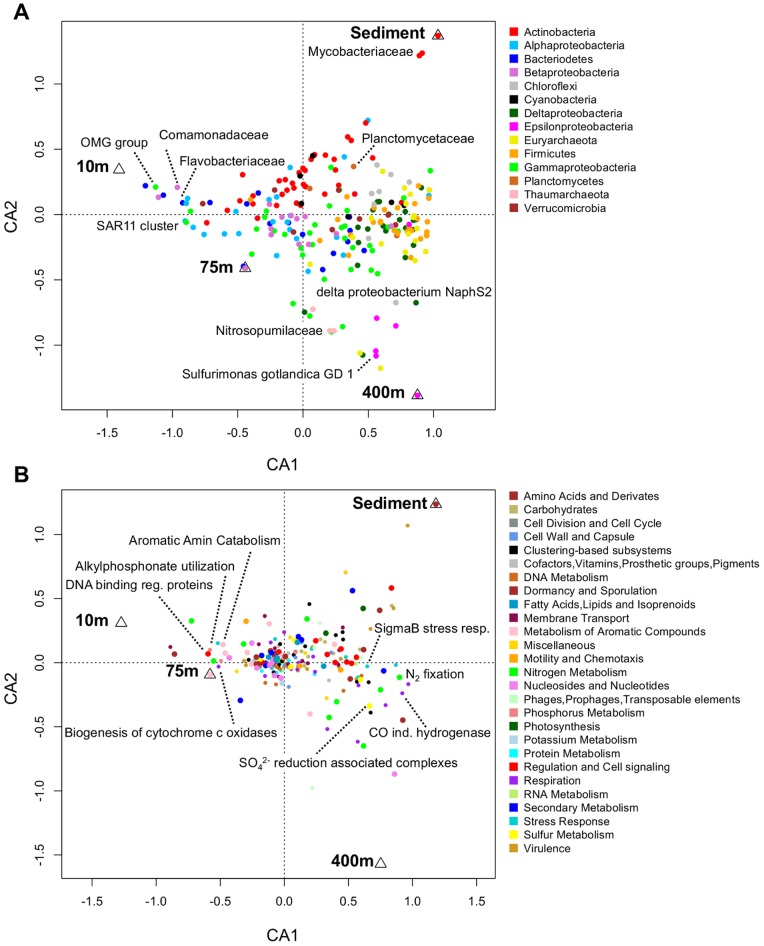
Figure 2. Correspondence analysis of taxa and functional capacities of Landsort Deep metagenomes.
Correspondence analysis of the sampled Landsort Deep bacterial/archaeal communities based on taxa and functional capacity, respectively. a) Ordination diagram from CA of relative abundances of taxa (rank of family). CA1 and CA2 represent 59% and 27% of the total variation, respectively. Families affiliated to phylum (or class in the case of Proteobacteria) contributing with >1% to the total communities is shown. The most dominant family or species within each phylum/class is indicated with text if >0.9%. b) Ordination diagram from CA of relative abundances of functional capacities represented by SEED categories (hierarchy 2). Of the total variation 76% and 14% were reproduced on CA1 and CA2, respectively. SEED categories, within parent categories (SEED hierarchy 1) showing large variation (i.e. >25% difference between highest and lowest value), are shown with larger circles. The four SEED categories at the furthest ends of CA1 with relative abundance >0.1‰ in each community or >0.5‰ in at least one community, are shown. Triangles represent the positions of samples in the ordination diagram. For detailed data see Table S5.

