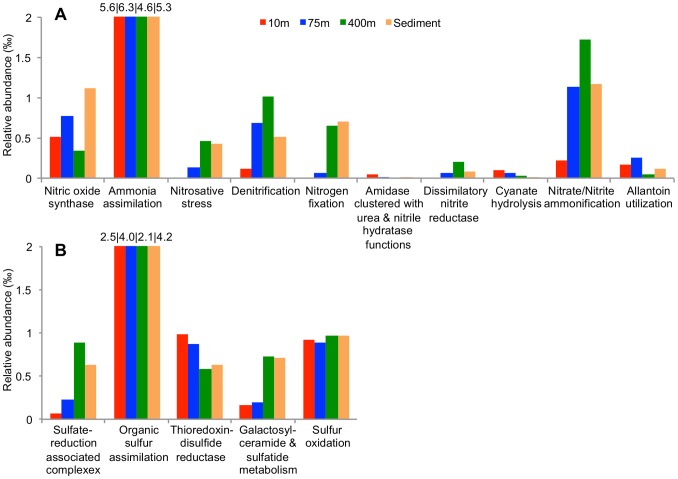
Figure 3. Nitrogen and sulphur metabolism of the Landsort Deep.
Relative abundance of reads assigned to SEED categories within a) nitrogen metabolism and b) sulphur metabolism for the four Landsort Deep metagenomes. Numbers above truncated bars represent corresponding max value for the 10 m, 75 m, 400 m and sediment metagenome, respectively.

