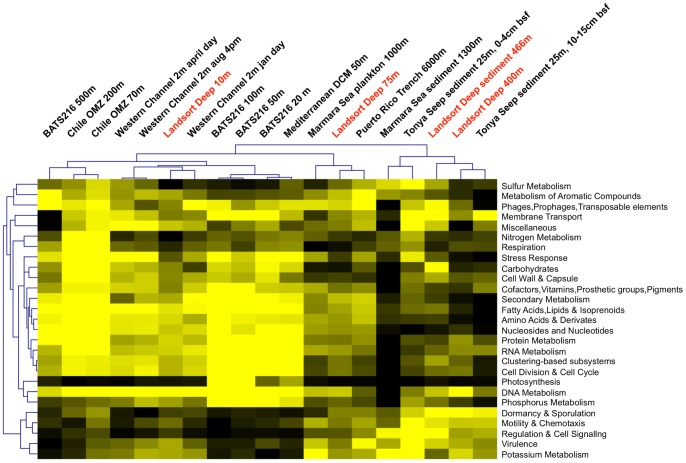
Figure 5. Comparative analysis and hierarchical clustering of functional capacities.
Comparative analysis of the functional capacity of Landsort Deep metagenomes with that of other aquatic metagenomes based on normalised assignments of sequence reads to functional categories of SEED (hierarchy 1). Yellow to black represents high to low relative abundance of SEED categories. Clustering was generated using Kendall’s Tau distance metric and average linkage clustering. For a more detailed cluster analysis see Figure S4.

