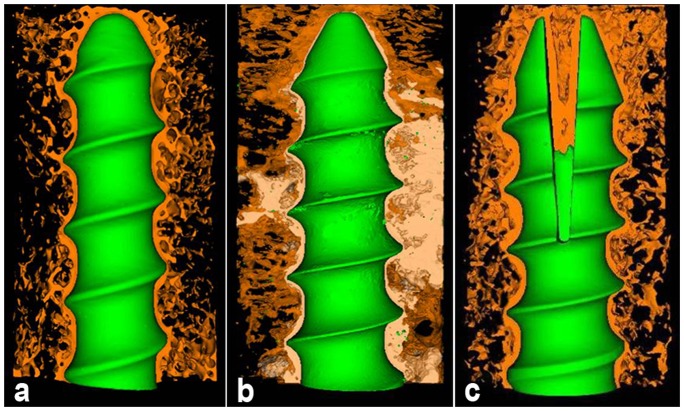
Figure 5. Three-dimension micro-CT reconstruction of interface between bone and screw in three groups at 12-week.
“a”, “b” and “c” indicate CPS group, PMMA-PS group and EPS group, respectively. Brown color, blue color and white color represent bone tissue, screw and PMMA, respectively. (Resolution 21 µm, 2048×2048).

