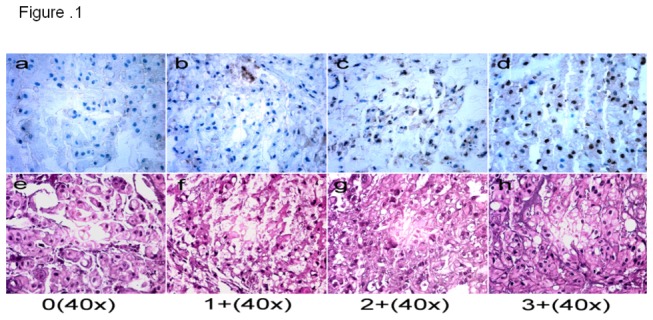
Figure 1. Representative expression of brachyury in chordoma tissues on TMA slide.

a 0 staining, no nuclear staining of tumor cells; b 1+ staining, <=30% nuclear staining of tumor cells, c 2+ staining 31% to 60% positive nuclear staining; and d 3+ staining, 61% to 100% nuclear staining.
