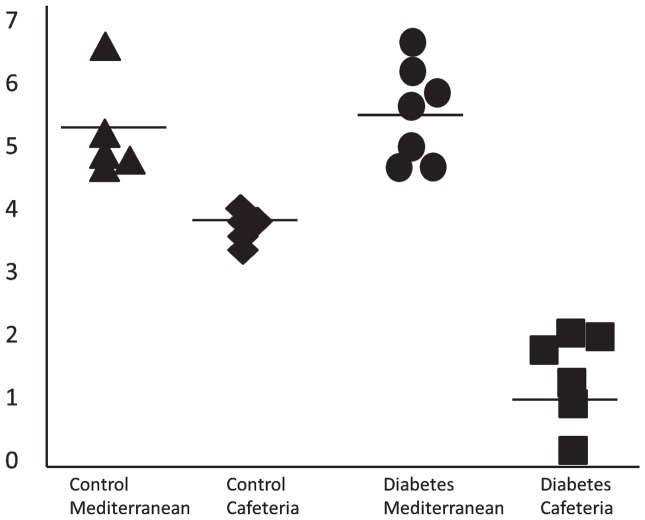
Figure 1. Example of proteome profile differences between control and diabetic pigs fed two diets.
Control and diabetic pigs were either fed a healthy Mediterranean diet or a cafeteria diet differing mainly in fatty acid composition. Plasma protein profiles were determined with a SELDI-TOF equipment and analyzed in relation to physiological parameters. Expression levels of peak M/Z 28537, CM10 pH 7, fraction 3. Each dot represent the expression level found in a pig. The horizontal bar represents the mean. ▴: Control Mediterranean diet, ♦: Control Cafeteria diet, •: Diabetes Mediterranean diet, ▪: Diabetes cafeteria diet.

