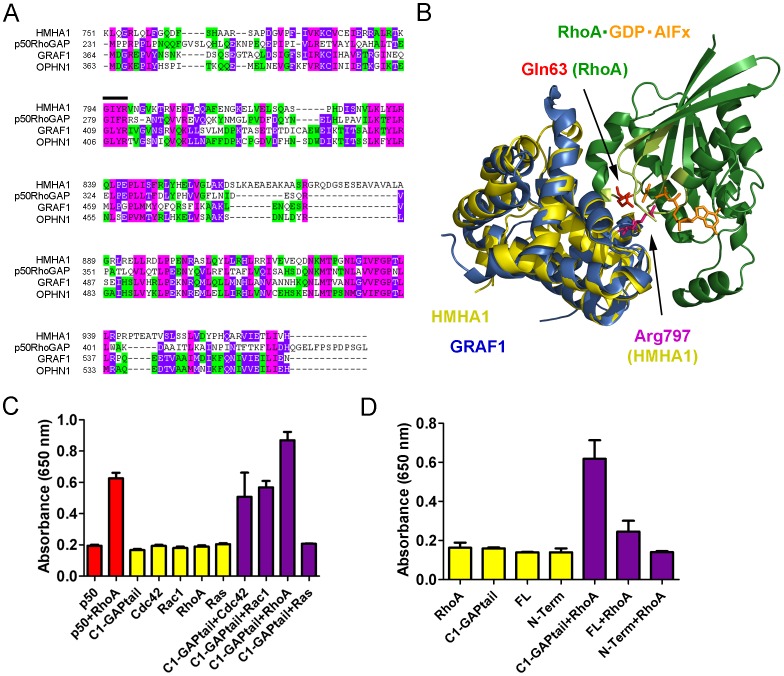
Figure 8. HMHA1 is a RhoGAP in vitro.
(A) Sequence alignment of HMHA1 with the typical RhoGAP, p50RhoGAP, and the structurally-related BAR-GAPs, GRAF1 and OPHN1. Green indicates two matching amino acids. Pink indicates three matching amino acids. Purple indicates four matching amino acids. The arginine finger region is indicated with a black bar. (B) 3D model of the protein-protein complex between RhoA and the HMHA1 RhoGAP domain highlighting the catalytic residues (in sticks, colour coding as indicated; P-loop-Switch I-Switch II of RhoA in light green). The homology model for the GAP domain of human HMHA1 is based on the structure of the human p50RhoGAP domain (PDB ID: 1tx4), using Phyre. The position of the HMHA1 GAP domain in the complex with human RhoA (from RhoA⋅GDP⋅AlFx⋅p50RhoGAP; PDB ID: 1tx4) was obtained through its overlay on the p50RhoGAP domain. The RhoGAP domain of GRAF1 from Gallus gallus (PDB ID: 1f7c) was superimposed onto the model of the HMHA1 GAP domain. (C) HMHA1 C1-GAPtail has in vitro GAP activity towards Rac1, Cdc42, and RhoA but not towards Ras (purple bars). p50RhoGAP was used as a positive control (red bars). GTPases or HMHA1 only were used as a control and as a measure for intrinsic nucleotide hydrolysis (yellow bars). Data are mean values of two independent experiments. Error bars indicate SD. (D) HMHA1 GAP activity is inhibited by the N-terminal BAR domain as full-length HMHA1 has no GAP activity while C1-GAPtail, lacking the N-terminal region, shows GAP activity (purple bars). GTPases or HMHA1 only were used as a control and as a measure for intrinsic hydrolysis (yellow bars). Data are mean values of two independent experiments. Error bars indicate SD.

