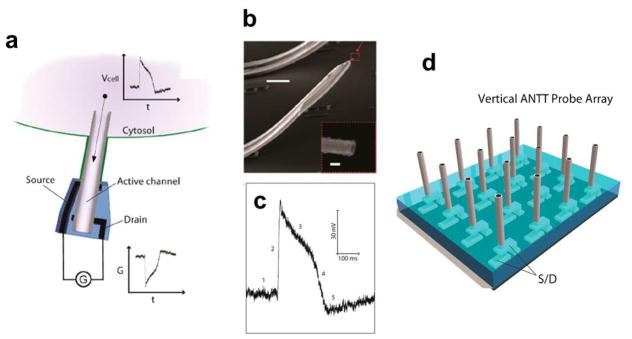
Figure 11.

Intracellular action potential recording with the ANTT. (a) Schematic illustration the working principle of intracellular electrical recording with the ANTT; (b) SEM image of an ANTT probe. Scale bar, 10 μm. Inset, zoom of the probe tip from the dashed red box. Scale bar, 100 nm; (c) A representative intracellular action potential peak recorded with an ANTT. The five characteristic phases of the action potential peak are denoted by 1–5; (d) Schematic of chip-based vertical ANTT probe arrays fabricated from epitaxial Ge/Si nanowires for enhanced integration. Reprinted with permission from Ref. [33]. Copyright 2012 American Chemical Society.
