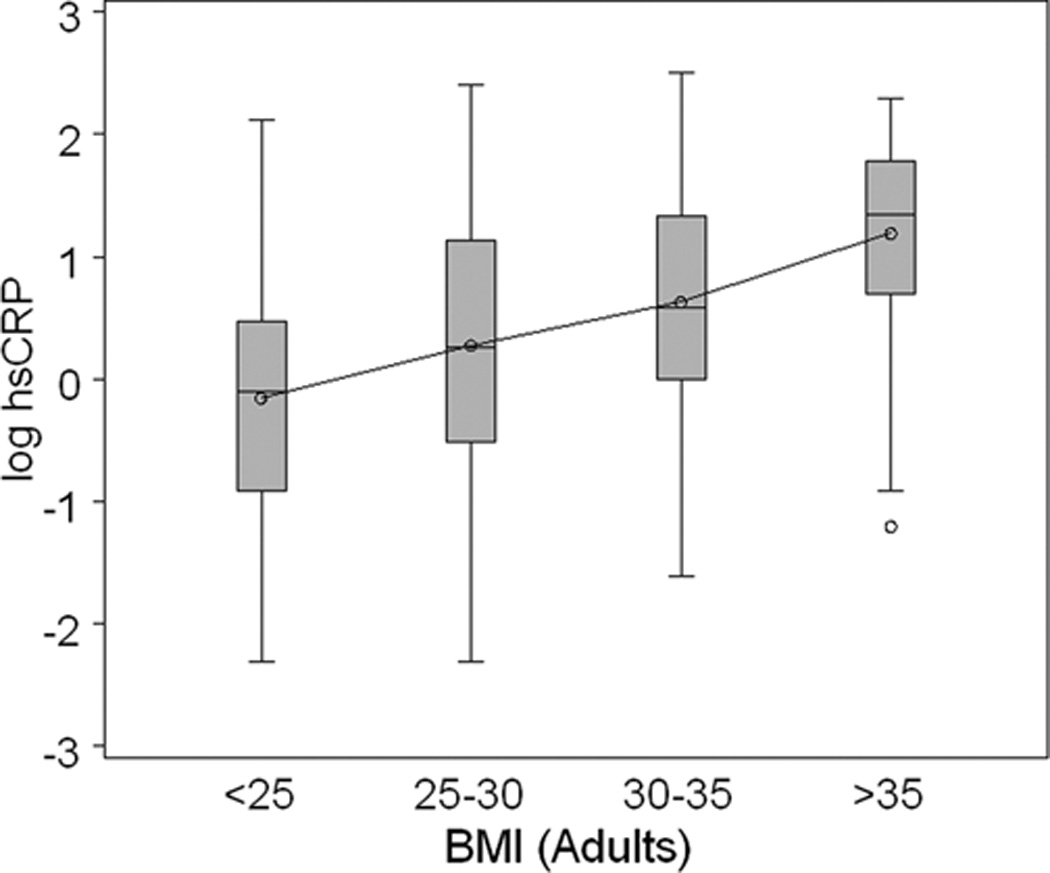
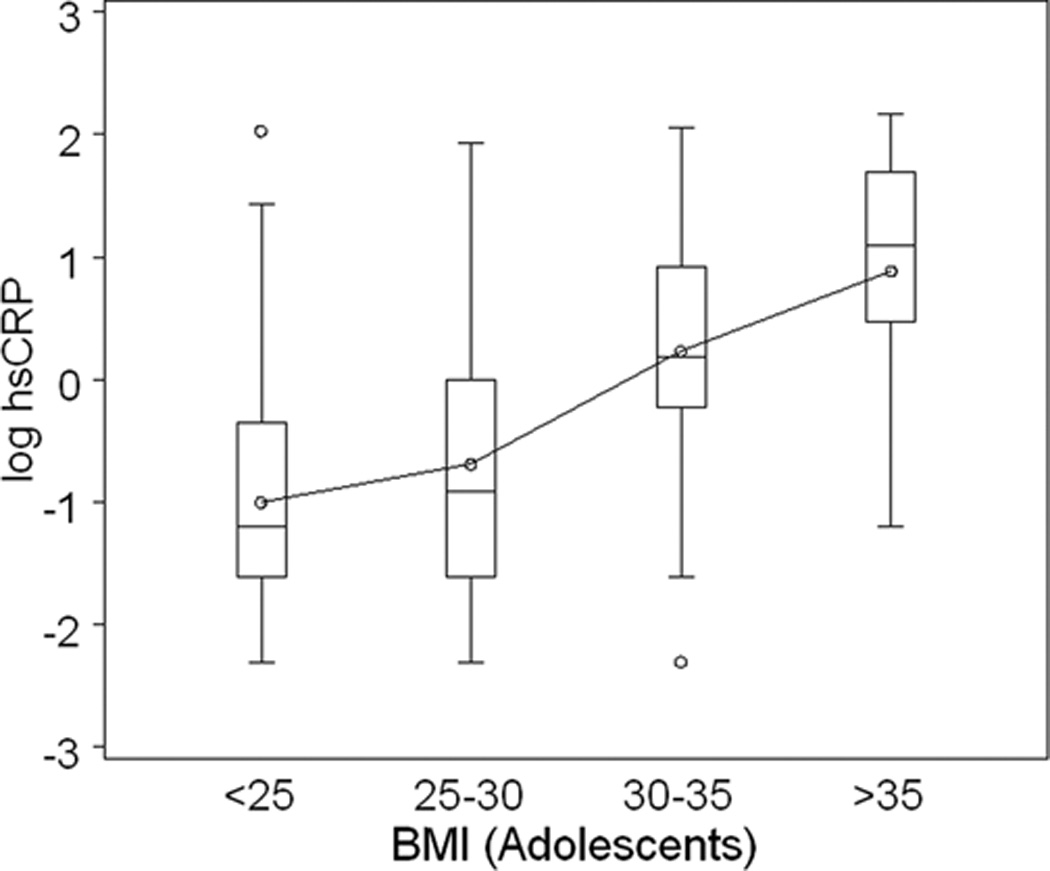
Figure 2. hsCRP and Body Mass Index (BMI) in Adults and Adolescents.


The box plots provide the distribution of log-transformed hsCRP in adults (A. upper panel depicted in gray boxes) according to BMI group; and in adolescents (B. lower panel depicted in open boxes) according to BMI group. The increase in hsCRP with increasing adiposity is present in adults and adolescents. As BMI exceeds 30 kg/m2, the log hsCRP distribution is similar in adolescents and adults.
