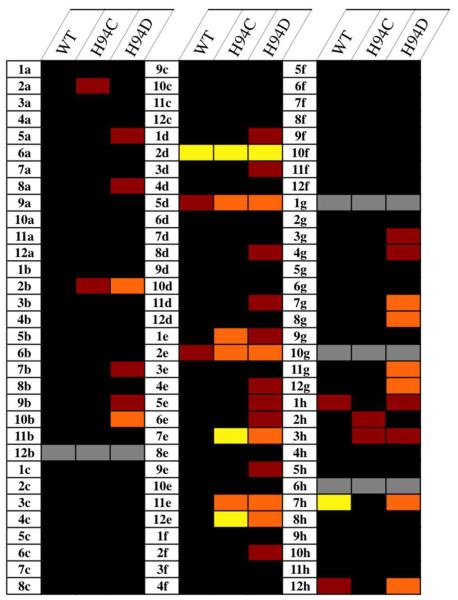
Figure 10.
Thermal plot representing the results of screening CFL-1.1 fragments against hCAII variants. Cells are color-coded by percent inhibition at 500 μM: black (<20%), red (21–40%), orange (41–60%), yellow (>60%). Gray cells indicate that compounds were not tested due to interference with the assay (1g) or lack of solubility under the assay conditions (all others).

